Wind originates from the changes in air pressure from place to place in response to solar insolation.
Extracting energy from wind is not a new idea as wind power has been used, for millennia, to grind grain, to pump water, and to move ships across water.
However, electricity, produced from wind turbines, is a more recent development. While practical windmills have been in existence for hundreds of years, the thermodynamics and operational aspects of modern wind turbine technology were derived only within the past century and are a bit more complex than just harnessing the kinetic energy of wind and converting it into electricity.
Wind is a global power resource, estimated to lie between 45 and 100 TW [1]. This may be compared with the global human average power demand of ~20 TW (~170.000 TWh/8.766h).
The estimated global wind, in principle, could then, theoretically, meet the present global average power demand?
Right?… well no, not really.
What is so attractive about wind energy?…the same energy that powered medieval Europe for centuries. Maybe because it appears to be unlimited?… or is it that it appears to be “free”?…or how about because it appears to be “clean”? What makes the subject of wind power so complex and challenging and why are there critiques like myself?
Let us have a quick look at the global wind map in Figure 1 below, you can see the first problem right there… where the vast majority of the global population lives, wind appears scarce!
If you want to understand a little bit more about wind, please continue reading…
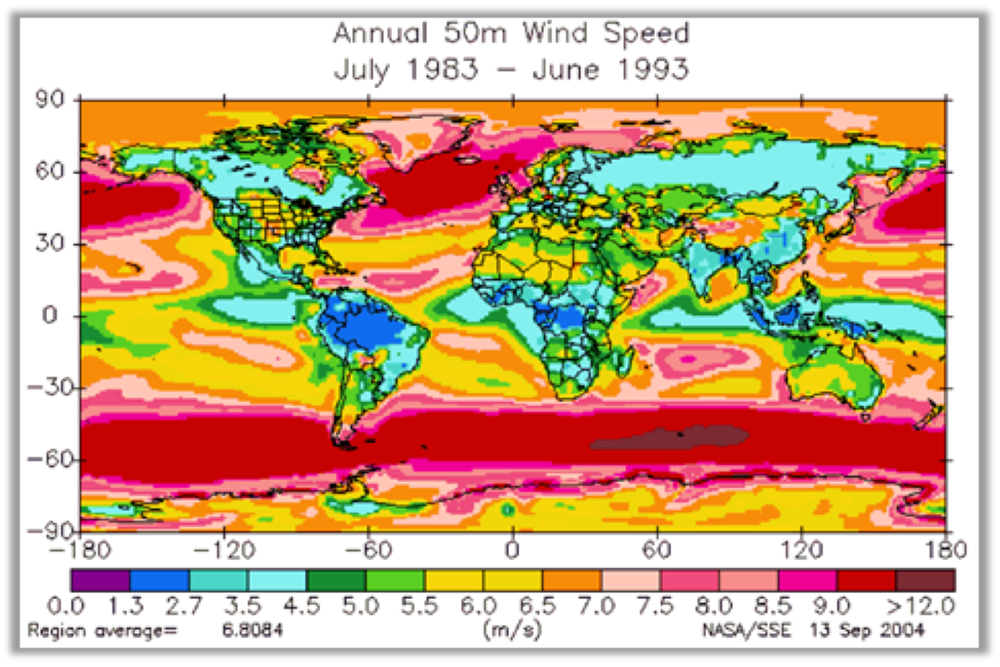
Figure 1: Mean speed and distribution of the global wind resource | Source: NASA 2022
- Natural capacity factors, utilization, and conversion efficiency
Just like solar energy, wind energy is an intermittent power source fueled by nature (wind), meaning it is heavily dependent on the weather, and it cannot be controlled like dispatchable power fueled by conventional coal, gas, or uranium can, necessitating backup energy sources such as batteries and traditional power plants.
Now, that fraction of time that the wind blows at a useful speed to power a wind turbine is called natural capacity factor which results in an estimated average (%) per annum. Globally this percentage lies around 21-24% (Figure 2) with certain areas of the European North Sea sometimes reaching as high as 45%. In large parts of Africa, Southeast Asia, India, and also China, where billions of people live and industrial production soars, the natural capacity factor for wind reaches but only single digits.
- natural capacity factor (nCF) x utilization = net load factor
Thus, when we speak of the natural capacity factor, we are only referring to the capacity factor derived from nature, not the technological or operationally driven “utilization” (often referred to as uptime, plant load factor, or PLF, more details here). In other words, when technology fails, or a power plant is turned off on purpose, this will reduce the utilization but not the natural capacity factor. The product of these two measures, is what we define as the – “net load factor”.
None of these terms though, have anything to do with conversion efficiency, which measures the ratio between the electricity output (useful or not) from an energy conversion machine (factory or plant) and the input, in energy terms.
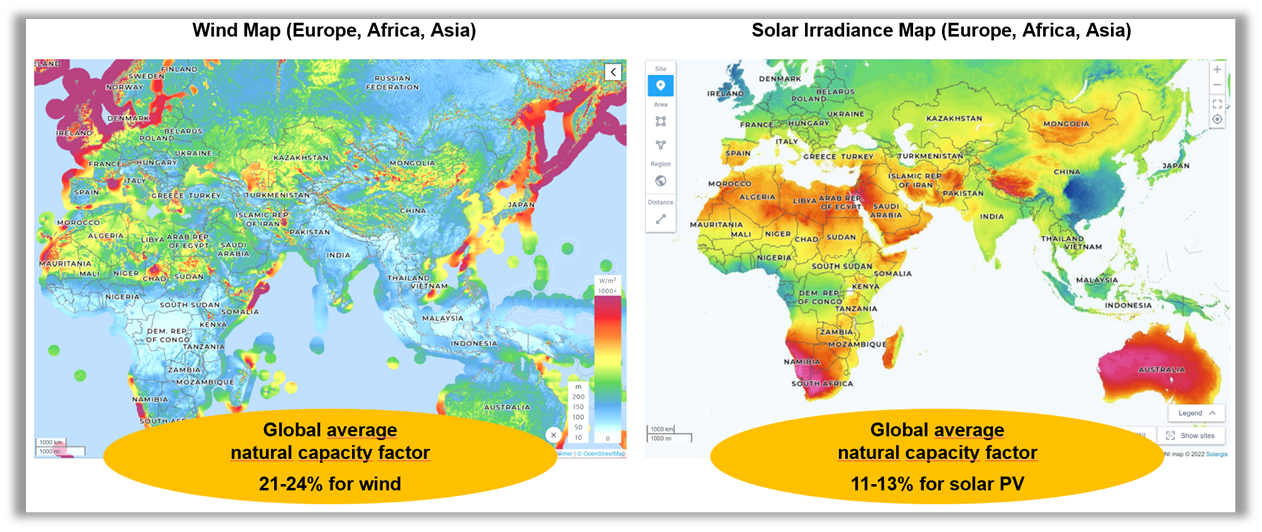
Figure 2: Global average capacity factors according to Carbajales-Dale et al. 2014
Source accessed 11 Feb 2022 : Global Wind Atlas (setting Mean Power Density – for the 10% windiest in the selection region at 100m height), www.globalwindatlas.info; Global Solar Atlas, www.globalsolaratlas.info (setting Direct normal irradiance, DNI)

Figure 3: European Gas and Wind generation 2024, Oxford Energy [2]
Conversion efficiency is thus the % of dispatchable electricity a gas-fired power stations “produces” from inflowing gas, or the % of intermittent electricity a wind turbine “produces” fueled by wind. Both gas and wind are primary energy, and for more details please refer to my recent blog post on primary energy.
The next element of the equation to consider is location… and since existing wind installations are already largely occupying the prime locations worldwide and technology is reaching physical limits, one could logically expect the average “natural capacity factors” to now start decline over time. This is contrary to “Net-Zero” plans often assuming that the average global natural capacity factors will increase over time (see IEA, McKinsey, BCG, IRENA, and many more).
The net energy efficiency (or eROI) for wind is usually higher than for solar, not only but mostly driven by wind’shigher natural capacity factor, see Figure 2.
What is interesting but not a widely known fact, is that wind resources correlate across large areas, often continent wide, as illustrated by dark wind lulls (“Dunkelflauten”) during the Winter of 2024/2025 [2, Figure 3] and during previous years like the European wide Dunkelflaute 1996/1997.
The physics and therefore economics of electricity generation using wind turbines is a bit more complex and I feel I should elaborate more in the next section (which you may skip, if it gets too technical).
Please note that large parts of this blog comes from our (Prof Bill Smith and my more detailed research paper on Wind “An Introduction to Wind Energy” available at Elsevier’s SSRN here)
2. Wind turbines and how they work
While practical windmills have been in existence for hundreds of years, the thermodynamics and operational aspects of wind turbine technology were derived within the past century by Betz who determined the maximum conversion efficiency of an ideal wind turbine to be 59,2% (Betz 1926). The Betz efficiency is not related to the natural capacity factor but optimizes power extraction from the wind, when the wind actually blows. Thus, technological improvements strive to get as close as possible to this maximum Betz efficiency of wind power extraction.
Real-world turbines operate below this limit due to various losses in the gearbox, inverter, and other components. Today’s newest turbines already reach over 40% conversion efficiency, close to the physical limits… so don’t expect any wind technology miracles during the next decades.
The Weibull wind speed distribution (Weibull 1951) is a famous graph that plots the probability of wind speed and power extraction. You want to use your wind turbine as much as possible at the highest wind speed, but nature limits you. The Weibull curve is the dashed line in Figure 4 and follows closely the typical speed distribution of winds found globally.
The wind turbine then extracts power, P, given by the volumetric flow of air through the turbine, multiplied by its Betz efficiency, Cp, for the wind turbine design, according to below Equation 1, where ρ is the air density, A is the turbine rotor area, and V is the wind speed.
P=½ Cp*A*ρ*V3
The cubic dependence of power output on the wind speed (Equation 1) causes the rapid increase in electrical energy production as the wind speed increases (Figure 5, see red line).
A wind turbine output – through the rotor shape – is designed to saturate at a specific wind speed, for optimization purposes usually near 12 m/sec. According to Equation 1, a wind turbine in a 17 m/sec wind should yield 22 times more electricity than the same wind turbine in a 6 m/sec wind. However, past the saturation wind speed, the electrical output is held nearly constant by adjusting the rotor shape and orientation to avoid it blowing up.

Figure 4: Weibull wind speed distribution curve | Note: Power extraction curve is plotted against Weibull curve (colored). Histogram and Weibull fit of wind speed probability and energy production share. The measurement is taken 100 m above ground, mean wind speed is 7 m/s containing about 250 W/m2 of WT area(swept). Energy production in the plot is calculated for Vestas V90 2 MW. | Source: Weibull 1951, Olauson 2014, p10, Fig 2.1

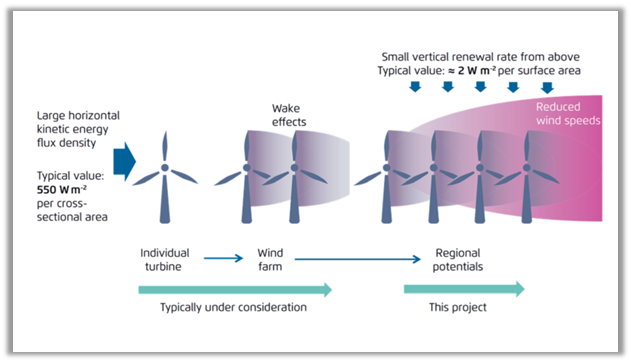
Figure 6: Illustrating wake effect and energy rate of restoration (ERR)
This necessary technical manipulation logically results in a loss of efficiency. Rotor control permits operation of the turbine in wind speeds up to 25 m/s without destroying it. As wind speed increases above ~25 m/s, the turbine usually turned off to avoid its destruction.
Logically, little power can be produced at wind speeds below 5 m/sec. A wind turbine could easily be designed to operate in a 5 m/s wind at higher natural capacity factor, but the energy output would be lower. An efficient wind turbine is the compromise between the probability of wind speeds (Weibull wind distribution) and the optimization of the energy output.
Wake effect: The downstream wake effect of wind farms has received detailed study [3]. A natural capacity factor loss of between 20% and 50% can occur due to wind suppression, and rotor induced vortices, following the first turbine row. To minimize wake losses, a wind turbine spacing of 15 turbine rotor diameters is recommended from wind tunnel studies [4].
Existing wind farms rarely meet these optimization criteria. The number of turbines per km2 scales with the diameter of the wind turbine rotors as they become larger. This means the extractable power per km2 remains approximately constant despite technology improvements, since larger wind turbines need to be spaced further apart. The number is 1-2 MW/km2, not more. Technology CANNOT fix this!
Example: The new French Banc de Guérande Offshore Windfarm with 480MW installed capacity over just 78 km2, translating to over 6 MW/km2 [5]. According to Wikipedia, this windfarm generated only 1.333 GWh in 2024 or worked at an estimated natural capacity factor of 32% assuming no curtailments. This is a fraction of the 45-50% promise made prior begin of operation [6].
Think about it, too many wind turbines placed close together would literally stop the wind. The energy restoration rate ERR determines how fast the wind can be replenished by nature from the atmosphere… and that is limited to the same 1-2 MW/km2 (or 1-2 W/m2, even the “transition” supporting German AGORA confirms 2 MW/km2), Figure 6.
3. Environment
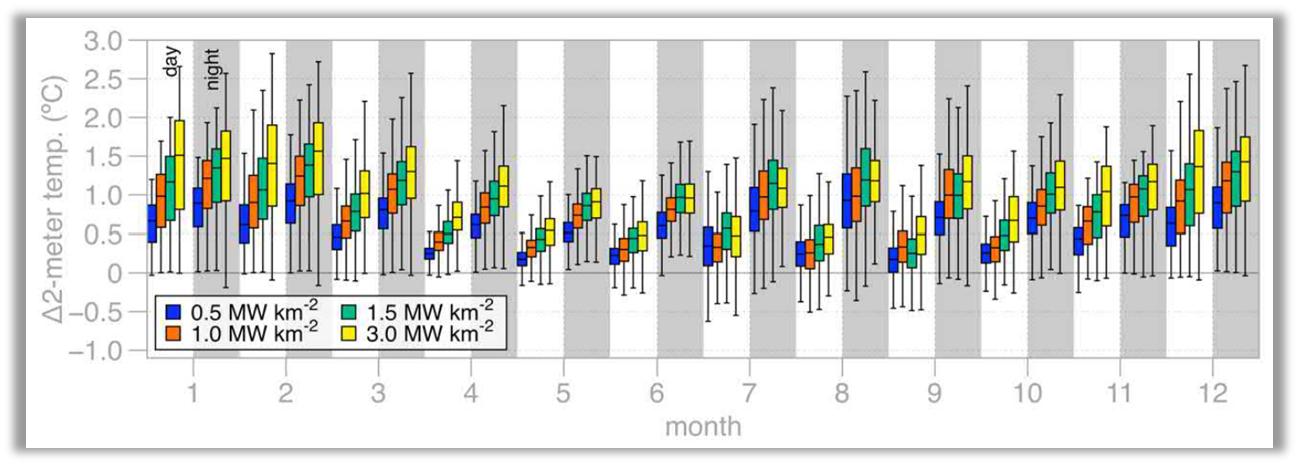
Figure 7: Warming impacts of large-scale wind farms | Note: Day and night 3-year monthly mean 2 m air temperature differences over the wind farm region between various turbine densities and the control simulation. Vertical line is 1.5-times the interquartile range and the box represents the 25th, 50th, and 75th percentiles
Source: Miller and Keith 2018, supplemental material, Figure 7
We understand that all energy systems have the positive impact of giving humanity the energy required not only to survive but also to develop further. All energy systems, including coal, gas, hydro, nuclear, and yes, also wind and solar have a negative impact on our environment.
The environmental and safety impact of wind power generation is not only driven by the wind turbines itself but by the ancillary systems required to make the electricity they generate “useful” as explained in the next section. You also have to consider the energy and raw materials required to build the turbines and more importantly the ancillary systems built by using cement, steel, fibre glass, aluminum, copper and a hundred more components that are not possible without coal, oil, and gas.
Additionally, grid-scale wind power systems impact
- bird, insects, and other animal life,
- magnetic fields and infrasound (Bellut-Staek 2024 [7] example), and
- the climate
Various researchers made measurements and modeled climate effects in large wind farms and made those public in the scientific literature (see [1], [8], [9] and Figures 6 and 7). The clear result: “Large-scale US wind power would cause warming that would take roughly a century to offset” (Science Daily 2018, Figure 7). At scale large wind farms warm the climate, which is also true for solar.
For example, Lu et al. 2020 [10] have detailed global rise in temperature and northward shift of the Intertropical Convergence Zone ITCZ caused by large-scale solar PV farms in the Sahara. Devitt et al. 2020 [11] also demonstrated grid-scale solar PV induced warming. Fully build-out to match power demand specified by “Net-Zero 2050” could raise global temperature by over a degree centigrade, negating the purported benefit of decarbonization.
Large scale wind farms effects cloudiness, precipitation, and cause stagnation of air masses, all of which lead to undesirable climate consequences.
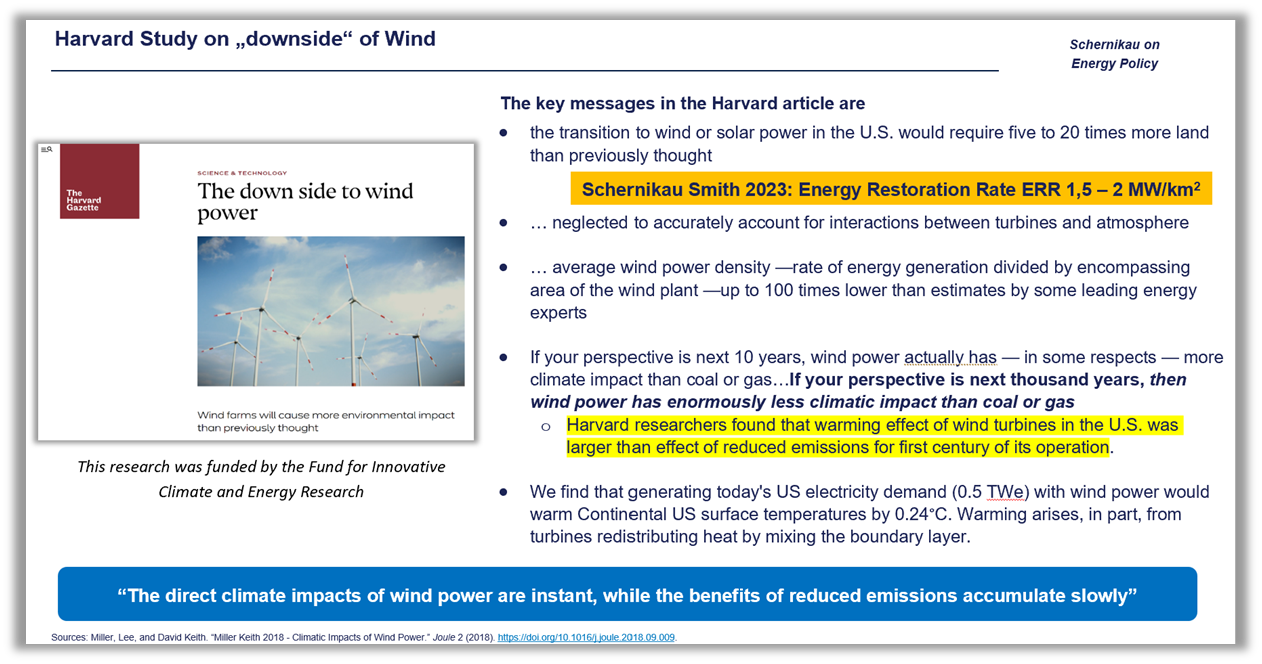
Figure 8: “Large-scale US wind power would cause warming that would take roughly a century to offset”, Science Daily 2018, Miller Keith [8]
4. Costs and supply chains
Intermittent “Renewables” such as wind and solar claim to be low cost thereby reducing the power bill of the everyday citizen. That this is unfortunately not the case and that this assumption is based on the inappropriate levelized cost of electricity LCOE is now becoming common knowledge (Emblemsvag 2025, most recent study, also referencing some of my work [12]). I have written and published on this topic repeatedly (see here) and the academic press is also becoming more outspoken on this subject.
The fundamental reason why wind (and solar) at grid scale are the most expensive and are becoming increasingly more expensive with higher capacity shares, relates to (a) the low energy density, (b) the short operational life-time [13], and (c) the intermittency. To overcome all this, you have to build and consider so much more of which some needs to be replaced regularly [14]:
- Vast overbuild to compensate for low natural capacity factor, energy losses, and to charge storage
- Short duration energy storage (batteries?) to overcome short-term fluctuations
- Long duration energy storage (hydrogen?) to overcome days and weeks of slow wind speeds that correlate across continents
- Thermal power plants as backup (in the future powered by hydrogen?)
- A much larger and more complex network integration infrastructure.
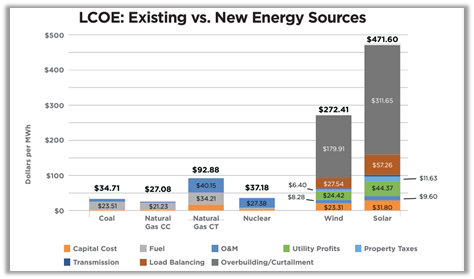
Figure 9: electricity cost… a more comprehensive view | Note: Load balancing is the cost of battery storage. Overbuilding and curtailment costs are so high because it was cheaper to overbuild wind and solar and curtail them than building more battery storage. | Source: Orr and Roling 2024 [9]

Figure 10: Top 15 Wind manufacturers
Another interesting challenge is the matter of supply chains . China already controls the vast majority of electric vehicle and solar panel supply chains and manufacturing. Next is the wind industry, with China building the largest, turbines the fastest and at the lowest cost. [15]. The vast majority of wind turbine manufacturers are now in China (Figure 10) producing and distributing worldwide.
Geopolitically speaking, the world’s increase dependence on China for wind, solar, and EV manufacturing capacity is of course an issue. An example of rare earth metals are critical raw material components used for permanent magnets in wind turbines, and supply of these magnets are also largely controlled by China.
It might be useful to know that in 2010 China had already put a temporary embargo on rare earth metal exports to Japan [16] and in 2024 China banned exports of gallium, germanium, antimony and others to the US in response to the US administration trying to block sales of advanced computer chips to China.
5. Current market, offshore and onshore
The backlash against large grid-scale wind projects can be best seen when examining offshore wind projects over the past months and years. Offshore wind has higher natural capacity factors than onshore wind, that is still usually far over estimated, as you could see in section 2. However, offshore wind comes with more challenges relating to construction, maintenance, operational lifetime, and network integration… not to mention the additional environmental issues relating to sea-life (whales and more).
Robert Bryce reported that “big wind faces existential threat,” Ørsted and Shell book massive offshore losses, Enel files appeal on Osage County verdict [17]. There are almost endless news reports giving details about the problems that Orsted, Enel, Enercon, Nordex, Vestas, BP, Shell, Siemens Gamesa, Equinor, General Electric and many more face (some sources of which can be found here [18]). The problems started probably 2-3 years ago, even before the political shift in the US. In early 2025, Trump stopped support for US offshore wind projects all together.

Figure 11: Reuters, 2024, [18]

Figure 12: Germany “Dunkelflauge during 11 to 14 December 2024. Germany had to rely on imports as coal and gas appear to be running at maximum capacity but couldn’t meet demand. | Source: Energy Charts
Norway’s Equinor, a leading developer in “renewable” energy, recently withdrew from offshore wind projects in Vietnam, Spain, and Portugal, citing unsustainable costs. Similarly, Shell has sold its stakes in projects across Massachusetts, South Korea, Ireland, France… and the list is almost endless [18].
On the other hand, onshore wind is not only becoming an eye sore, but also doesn’t generate much energy during the famous “Dunkelflaute”. Germany experienced “Dunkelflaute” several times during the recent 2024/2025 winter, when the country had to fall back on power imports as coal and gas appeared to be running at maximum capacity but not meeting demand, see Figure 12
6. Summary
Although wind energy is not new, electric wind turbines were only developed during the past century. The narrative that grid scale wind is low cost appears to be a myth. The cost of wind energy to a country (at system level) actually increases with higher penetration… and the same is true for solar.
Additionally, the environmental impact of wind turbines increases with higher penetration. It appears obvious that there is no “net zero” as the lifecycle emissions of wind are far from zero (even though marginal emissions are close to zero) when taking into account the backup, storage, transmission and overbuild required. We understand that environmental protection goes beyond greenhouse gases, and sustainability also includes economic sustainability.
It is time that we start looking at the full picture and that we start being honest with ourselves… wind and solar are NOT the solution to our energy problems, they in fact exacerbate them.
So what do we do now?
Our book “The Unpupular Truth… about Electricity and the Future of Energy” ends with the simple recommendation.
We urge energy policymakers to refocus on energy policy’s three objectives in that order: (1) energy security, (2) energy affordability, and (3) environmental protection. This translates into two paths for the future of energy:
(1) Invest in education and basic research to pave the way toward a New Energy Revolution in which energy systems can sustainably be weaned off fossil fuels, but at an increase in energy availability per capita.
(2) In parallel, energy policy must support investment in conventional energy systems (oil, coal, gas, nuclear) to improve their efficiencies and reduce the environmental burden of energy generation for our lives, at least until the New Energy Revolution has been realized.
Links and Resources
[1] Adams Keith 2013: Are Global Wind Power Resource Estimates Overstated? Environmental Research Letters 8, link
[2] European Dunkelflauten 2024/2025: Swiss News, Oxford Energy
[3] Akhtar et al 2021, Wake Effect: Accelerating Deployment of Offshore Wind Energy Alter Wind Climate and Reduce Future Power Generation Potentials.” Scientific Reports 11, link
[4] Meneveau and Meyers. 2011. Better Turbine Spacing for Large Wind Farms.” ScienceDaily. February 2011, link
[6] If the wind farm was expected to generate 20% of Loire-Atlantique’s electricity of 12-13 TWh: Expected annual generation = 0.20 x 12.5 TWh = 2.5 TWh; which means 48% capacity factor because 480 MW x 8760 hours/year= 4.2 TWh. link
[7] Bellut-Staeck 2024: Chronic Infrasound Impact Is Suspected of Causing Irregular Information via Endothelial Mechano-Transduction and Far-Reaching Disturbance of Vascular Regulation in All Organisms.” Medical Research and Its Applications, link.
[8] Miller, L. and Keith, D. 2018, Climatic Impacts of Wind Power, Joule 2, link
[9] Fitch, Anna 2015, Climate Impacts of Large-Scale Wind Farms as Parameterized in a Global Climate Model, Journal of Climate 28, no. 15, Aug 2015, link
[10] Lu et al. 2020, Impacts of Large-Scale Sahara Solar Farms on Global Climate and Vegetation Cover, Geophysical Research Letters 48, no. 2, link
11] Devitt et al. 2020, authored by D. A. Devitt, M. H. Young, and J. P. Pierre, Assessing the Potential for Greater Solar Development in West Texas, USA, Energy Strategy Reviews 29, May 2020, link
[12] Emblemsvag 2025: Rethinking the ‘Levelized Cost of Energy, A Critical Review and Evaluation of the Concept.” Energy Research & Social Science, link
[13] IER 2024: Wind Turbines and Solar Panels Are Aging Prematurely, link
[14] Orr, Isaac, and Mitch Rolling 2024, EnergyBadBoys: Why Nuclear Is Cheaper than Wind and Solar.” Substack newsletter, link
[15] Politico 2023, Europe Lost to China on Solar — Now It’s about to Do the Same with Wind.” link; and Recharge News 2024, “China’s Mingyang Lined up by EU Developer to Supply 18MW Offshore Wind Turbine” link; and NZZ 2024, “Erst Solarzellen, jetzt Windräder? China drängt mit einer neuen Flut auf den Weltmarkt.” link
[16] Rare Earth metal geopolitical pressure from China, Amid Tension, China Blocks Vital Exports to Japan – NYT and China Banned Exports of Rare Minerals to the US
[17] Robert, Robert. 2025. “Ill Wind, US Wind Sitation.” Substack newsletter, link
[18] various sources on wind companies’ problems: EE News, Reuters on Denmark, FT on BP selling wind, NPR on Orsted, Telegraph on Shell and Siemens Gamesa, MSN on Shell, Reuters on failing wind giants, Energy News on Sweden and wind, Energate on Vestas, OsageNews on Enel, Various news on other suppliers of wind turbines to Germany inc. Enercon, Nordex, Senvion, etc here