Rethinking the cost of electricity
in a complex energy system
Dr. Lars Schernikau
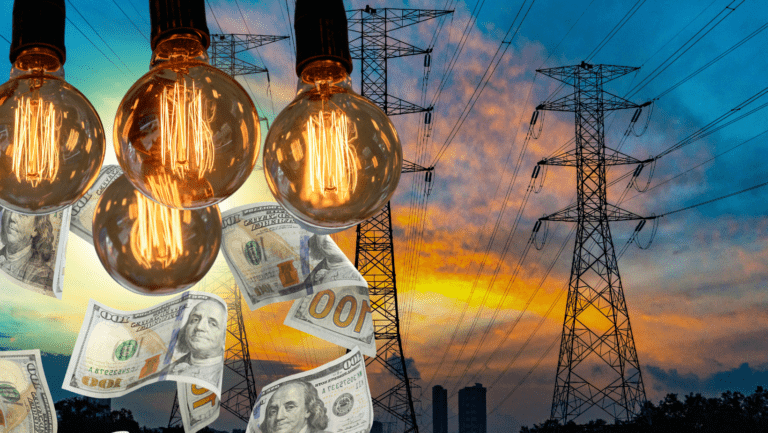
High energy costs deepen hardship, particularly for low-income groups, and hold back industrial development, not just in developing nations.
This is a universal truth and should be understood first (Figure 1).
In April 2026 the German Minister for Economic Affairs and Energy Ms Katherina Reiche stated on an official government website that: „An energy transition that ignores system costs will ruin a country, that it pretends to save” [1]
The IEA [21] confirmed in April 2026 that total energy demand keeps growing, while electricity demand grows 2.3x faster with peak power demand growing by another 1.8x faster. Shouldn’t we then start looking at peak-power serving electricity generation technologies and understand the cost better?
The subject of reliable electricity supply that meets peak power demand has become more prevalent as data center operators globally from Taiwan to South Africa to Germany and the US struggle to procure sufficient electricity supply.
The IEA also confirmed [21] “Data centers require highly reliable power, typically targeting 99.999% to 99.9999% uptime”. In other words, only peak-power serving technologies and systems that are available 24/7/365 with loss of load of 5 minutes a year are required.
The cost of supplying electricity to both industry and households has been debated for decades. Numerous studies have attempted to calculate the full system cost, but none has yet produced a consistently reliable figure in USD/kWh and the reason for it, I will explain. My own work has thus far, only captured the qualitative aspects of the Full Cost of Electricity, FCOE, but today this will change. My work in regards to the FCOE is based on a peer-reviewed study (Full Cost of Electricity ‘FCOE’ and Energy Returns ‘eROI’, at Elsevier’s SSRN) and was published in our recently updated book now available in 7 languages “The Unpopular Truth… about Electricity and the Future of Energy”
Energy costs in general, and electricity prices in particular, are back in the spotlight as global geopolitical tensions continue to shape markets. On the one hand they say, “electrify fast and build more wind and solar to become less dependent on energy imports”, and on the other hand we have… “we need to invest more in coal, oil, gas and infrastructure” to reduce the geopolitical dependence on one nation or region. As a consequence, China’s solar panel exports doubled to almost 70GW in March 2026 [22] and most Asian nations are significantly increasing coal imports [23]. So what’s the right approach? Which technologies should we rely on for electrification?
Well, let me tell you that when it comes to the cost of energy, the answer is a simple one: electrification relying on wind and solar technology is the most expensive and it gets more expensive the more wind and solar you utilize in the system.
By the way, as an introduction to the subject at hand, I recommend my recent article “The Problem with the ‘Primary Energy Fallacy’ ”. So now, let’s have a look at electricity costs.
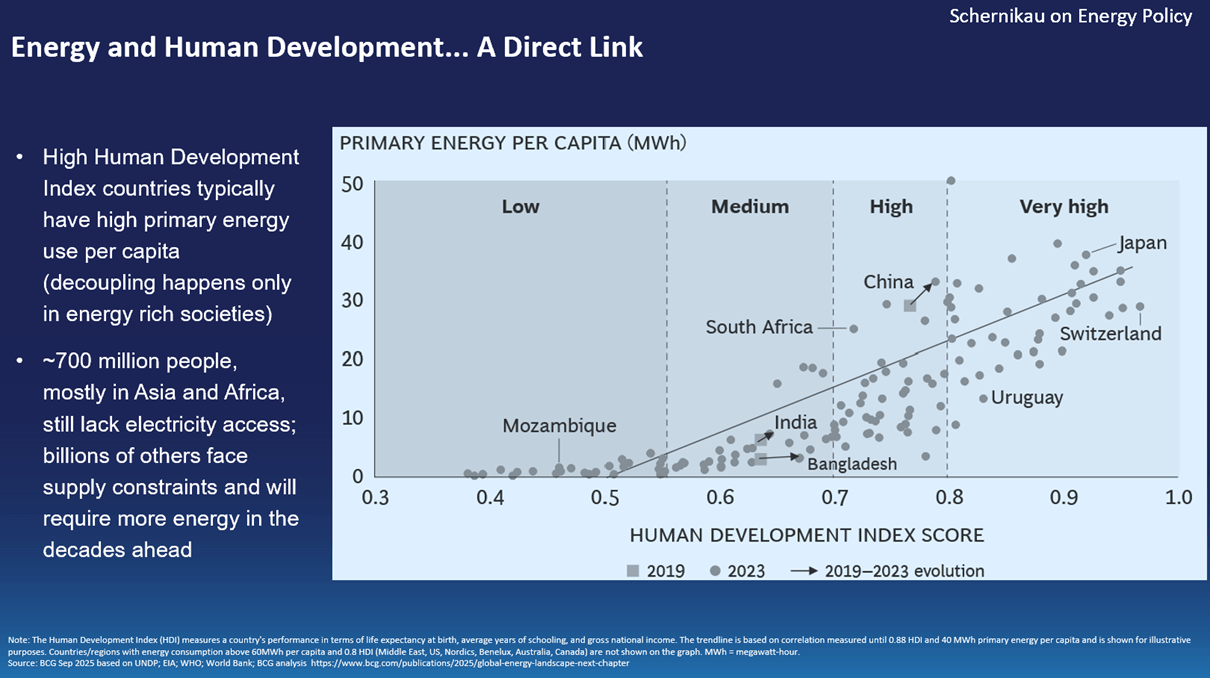
Figure 1: Energy and human development are linked
- Measuring the cost of electricity: LCOE vs FCOE (or LFSCOE)
Let us start with some interesting and thought-provoking quotes from the OECD and Europe’s UNECE on the cost of electricity:
- “We observe that typically the LCOE of the VRE [wind and solar] resource is only a fraction of the total system costs while the non-VRE resource [coal, gas, nuclear, hydro] has a relatively high LCOE but the same full system cost in a cost-optimized electricity system.” (UNECE 2025 [2], p17)
- “A higher share of variable renewables such as wind and solar PV always increases system costs.” (“OECD NEA 2024 [3], p26)
- “When VREs [wind and solar] increase the cost of the total system, … , they impose such technical externalities or social costs through increased balancing costs, more costly transport and distribution networks and the need for more costly residual systems to provide security of supply around the clock” (OECD NEA 2018 [4], p39)
- “The deployment of VRE [wind and solar] resources directly reduce the natural or intrinsic system inertia, with possible adverse consequences on the overall dynamic robustness of the system.” (OECD NEA 2019 [5], p72)
It is therefore clear that even the OECD and Europe’s UNECE are well aware of the fact that the widely used LCOE, levelized cost of electricity, does NOT capture the system cost nor true cost of electricity, least of all for wind and solar. Yet, the EU, the European Central Bank, and many others even the IEA keep making misleading statements about cost of electricity based on LCOE such as or similar to “…renewables remained the most cost-competitive option for new electricity generation” [6] which are then mirrored in the main stream media and understood as correct and factual by all. Sometimes those organizations add caveats or explanations that are hard for the average person to understand.
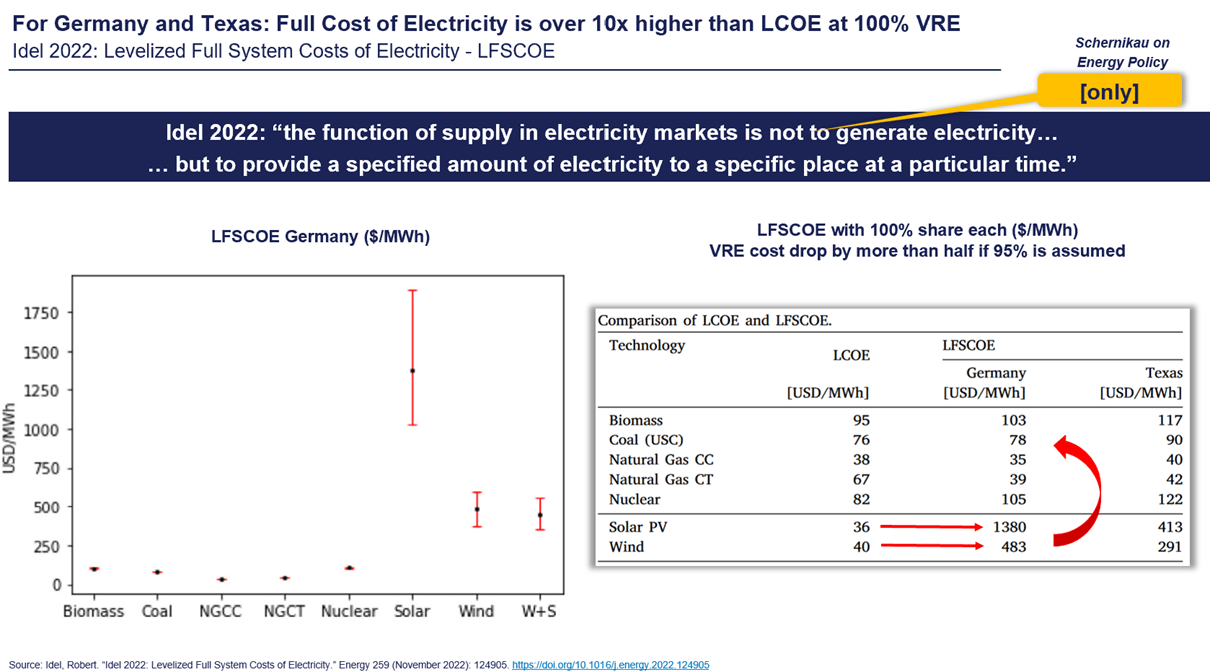
Figure 2: Levelized Full System Costs | Source: Idel 2022 [7]
There are various metrics we use to measure the cost of electricity and they range from simple to more complex. Not surprisingly, simple metrics have limited value when it comes to answering complex questions such as “should Germany put up more wind and solar or more coal and gas”?
LCOE = levelized cost of electricity
- most widely used and quoted
- the old simple way, relevant for dispatchable power,
- focuses solely on plant-level costs, it’s a “micro” view
- does not include system cost as balancing, network integration, transmission, backup, or storage costs, etc
LFSCOE = levelized full system cost of electricity (Figure 2)
- allocates all system integration costs to each technology individually
- assumes each technology must provide the full range of system capabilities within a single solution (see Idel 2022 [7])
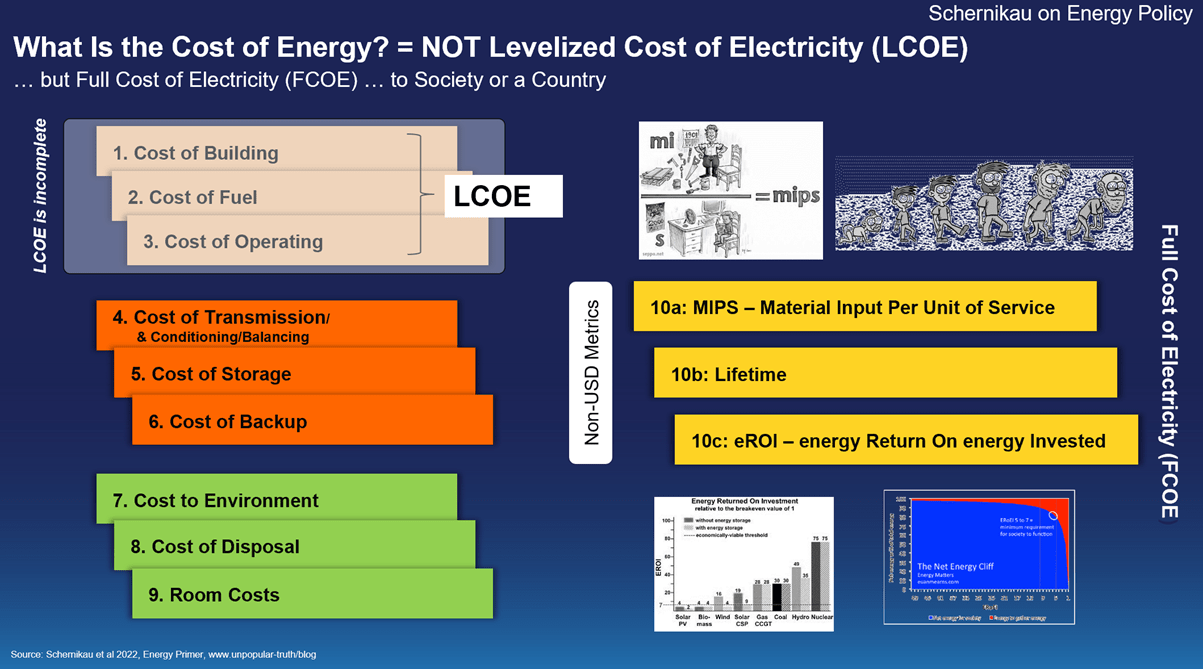
FCOE = Full Cost of Electricity
- the full cost of electricity to society or an entire nation, it includes the true full cost of power consisting of 10 categories (detailed in “Energy Trilemma”, here, [8])
- next to all storage, backup, transmission and network integration, it also incorporates the true raw materials, embedded energy, and net-energy returns of the system. It also includes the environmental cost, disposal and “room” costs.
Considering the LCOE, energy economists and now the Germany energy minister, find it lacking and incomplete, and it is not effective when used to make decisions regarding the “energy transition”. On the other hand, we have the LFSCOE which assumes one technology has to provide the full range of system capabilities within a single solution. This metric is more useful, but does still not give us a full and realistic overview.
Then we come to the FCOE which is the true full system cost at society level. This metric is complex, though not impossible to capture. The cost impact of introducing a new technology into a system is neither captured by LCOE nor fully by LFSCOE. As the penetration of a technology increases, its FCOE rises and gradually converges toward LFSCOE.
For further metrics like the IEA’s VALCOE (value-adjusted levelized cost of electricity), Lazards LCOE+, or LACE (levelized avoided cost of electricity), or LCOS (levelized cost of storage), please see the appendix.
2. How much does electricity cost?
That question is not as straight forward as it appears. One always has to state that “it depends” on where you are and what energy sources you use. One could simply take all costs associated with providing electricity to an entire nation and divide it by the TWh of generated power. As far as I know this has not been done yet, but it should be considered (the German EWI at ~300 EUR/MWh and Prof Hirth’s at 200+ EUR/MWh may have gotten closest to doing so, see [10, 11]). One “small” consideration not to be missed is that price does not equal cost (usually the price is higher), but often we have to work with price as an input and consider it a cost.
Prof Lion Hirth, Feb 2026 [11]: “Today, despite the fact that we are relying on substantial old (and hence cheap) infrastructure, the total cost of Germany’s power supply is well above 200 €/MWh.”
Cost allocation: Once you have the full cost, one important consideration becomes how to allocate these total costs to the different technologies. For instance, large installed capacity of wind and solar increase the cost of coal or gas, as these power plants are being utilized less.
So, logically, the cost of ‘decreasing efficiency’ , resulting from lower coal or gas power plant utilization due to wind and solar, should be allocated to wind and solar. Also, when any technology requires larger or more complex infrastructure or reduces system reliability and increases vulnerability, it should be held responsible for it (see my article Cyber security and critical infrastructure [13])
Mitch Rolling and Isaac Orr have also attempted to capture the “full cost of electricity” [13]. Figure 4 illustrates their modelling for Minnesota in 2024. You can see how relevant overbuilding/curtailment and load balancing becomes for wind and solar based systems. What I find interesting, and it was also confirmed by the OECD and others, is that wind and solar electricity cost is not static, it increases the more wind and solar you have in the system… that is also why the answer to the question is “it depends”.
In order to attempt to come up with “Lars’ 2026 electricity cost for Germany” we first have to discuss power price capture rates and system costs. So please bear with me.
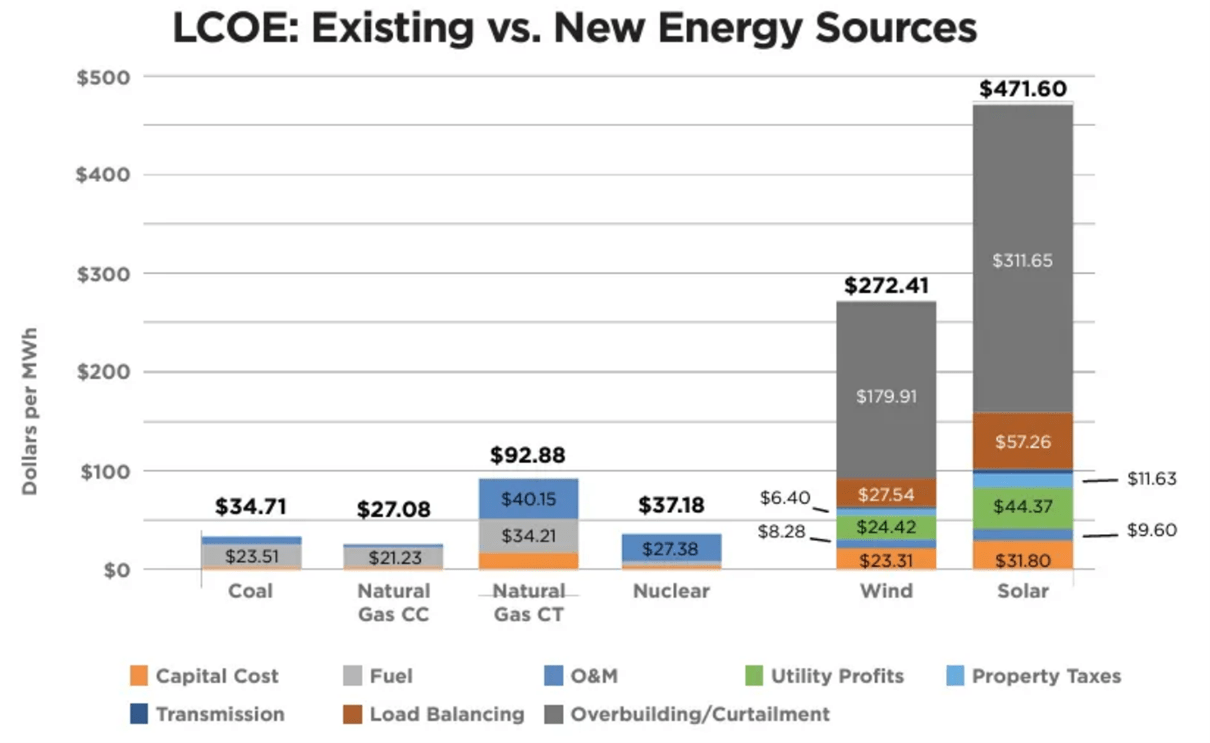
Figure 4: EnergyBadBoys Cost of Electricity for Minnesota in 2024 | [13] Note: Load balancing is the cost of battery storage. Overbuilding and curtailment costs are so high because it was cheaper to overbuild wind and solar and curtail them than building more battery storage.
3. Power price capture rates
A simple way to illustrate the “value” of power generation technology is to take a look at the power price capture rate or “capture rate”. It is one of those terms that reveals a great deal about system stress. Capture rate is defined as:
Capture rate = the average price a generator actually earns ÷ the average market price
“When this plant produces electricity, are prices high or low?”
- 100% (or 1.0) → earns exactly the market average
- <1.0 → produces when prices are lower than average (i.e. solar)
- >1.0 → produces when prices are higher than average (i.e. gas or coal)
- when one technology has a low capture rate below 1.0 (i.e. solar) then another technology HAS to have a high capture rate above 1.0 (i.e. gas or coal), that is just pure logic as the overall weighted average has to be 1.0.
The obvious now emerges, as wind/solar share increases, their capture rates fall. This is known as the cannibalization effect or price cannibalization. Please keep in mind that capture rates have nothing to do with the natural capacity factor nCF (a detailed analysis can be found here Nature’s Influence on Solar and Wind Power Generation, [14 ])
Yes, capture rates are also incomplete. Capture rates are not really a cost item but a market induced “value adjustment” of power generated. Capture rates do not include subsidies (such as but not limited to feed in tariffs FiTs, or contracts for difference CfDs) and they ignore all system costs (grid, backup, storage, overbuild, etc). Capture rates just give a current market view for the investor, and all the shortcomings of the metric should be considered. Capture rates do NOT give you the Full Cost of Electricity, FCOE.
Note on subsidies: Subsidies decouple investment from market value and allow capacity to grow even when capture rates and system value fall. This leads to:
- more overproduction
- more price suppression
- more subsidies required
Prof Leon Hirth has been writing about the market value of wind and solar or capture rates since 2013 [15] and recently estimated the solar and wind capture rates as detailed in Figure 5 matching almost perfectly his predictions from over 10 years ago [11 ] . Here one can see beautifully how the market value of intermittent solar drops the higher their grid system penetration. The same holds true for wind but to a lesser extent. (see my article Where the wind blows, [18]) 😉
For a crude estimate of the impact of the capture rate on electricity costs, one would simply divide the cost of an electricity generating technology by the capture rate to adjust the cost to the technology’s value. Similarly, this was recently done by Prof. Hirth using his own assumptions [14].
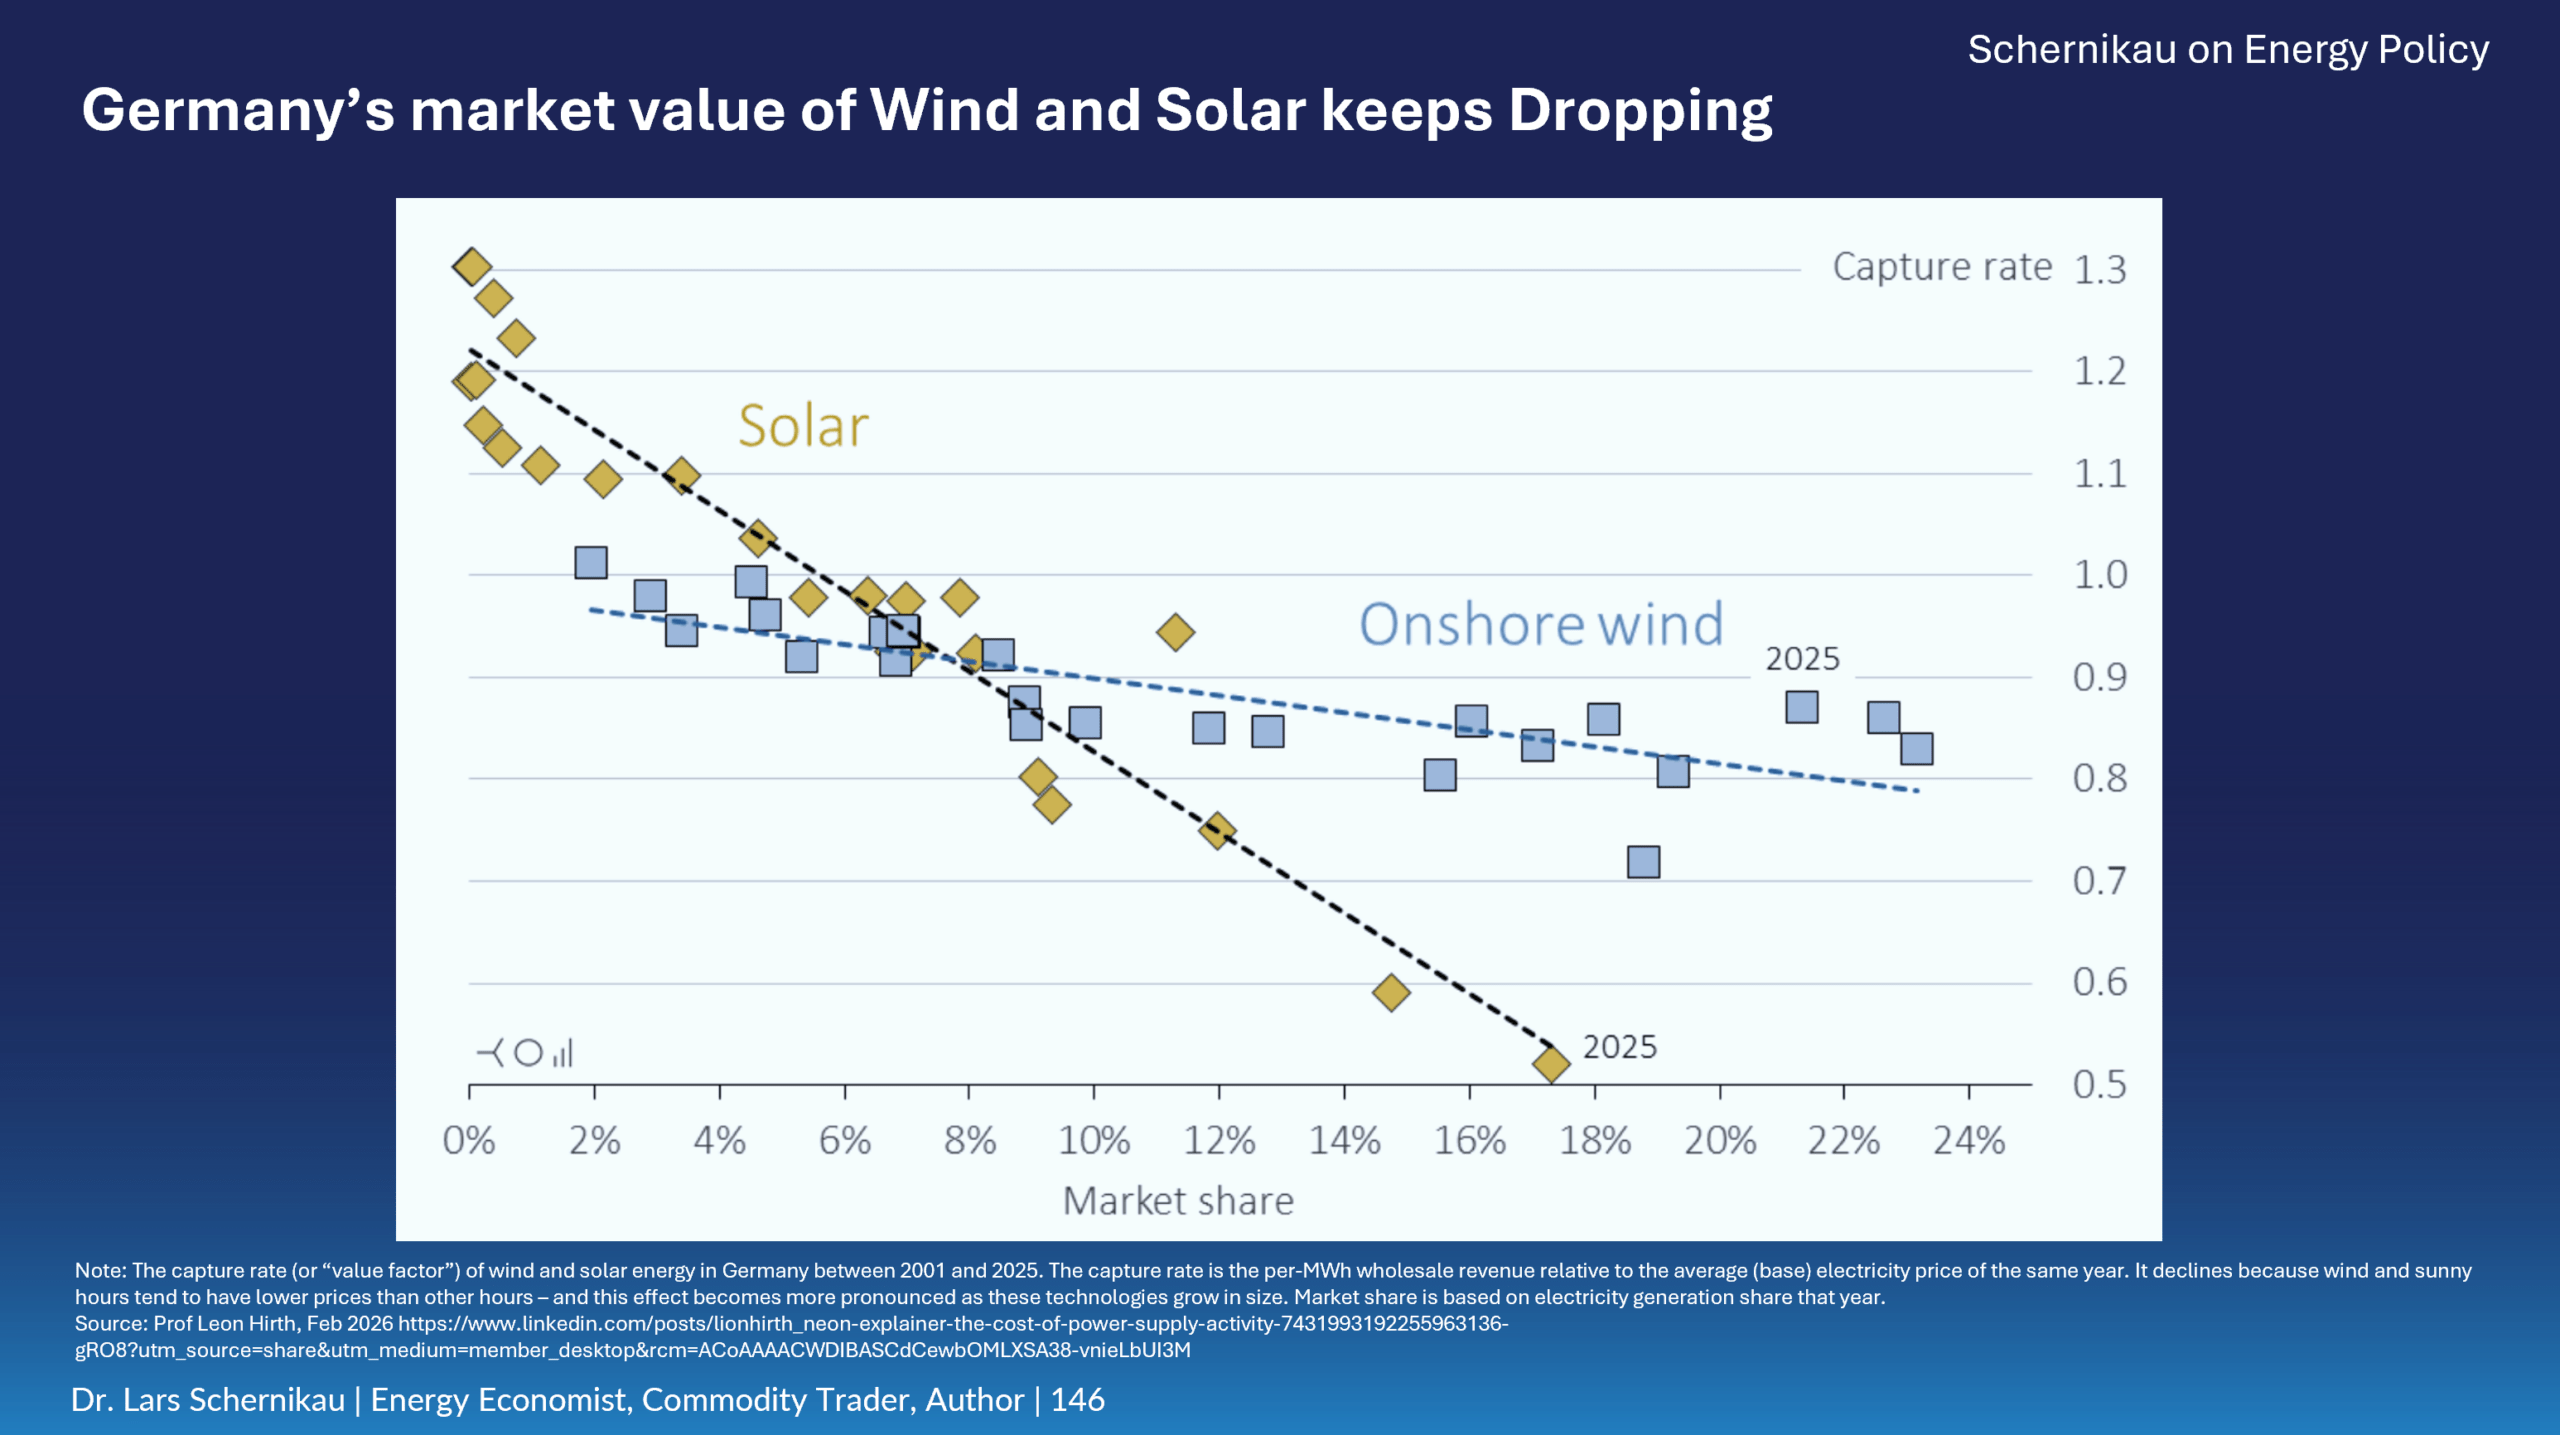
Figure 5: Solar and wind capture rates in Germany 2013 to 2025 | Source: Prof Hirth [15]
4. System costs of wind and solar
The second important category is system costs. Here, I am referring to the marginal or additional system costs driven by intermittent, low-energy-density wind and solar installations…costs required to make their output “grid-ready”. Remember that these system costs are not captured by the “capture rate” which is a pure market value adjustment.
Let us not forget that the electricity we use everyday is a service delivered to the consumer – it is kWh on demand 24/7/365 supplied by a thermal power plant. Electricity we use is NOT a product i.e. just a kWh supplied by wind or solar whenever the weather allows. Usable electricity that is grid ready has five main characteristics, none of which are provided by wind turbines or solar panels without additional ancillary systems each with a cost or “system costs” to be considered.
Five main characteristics of grid-ready electricity:
- voltage – system strength or electrical pressure, i.e. 220V,
- frequency – the instantaneous balance between supply and demand, i.e. 50 Hz,
- phase – synchronism between generators every milli-second,
- current – the actual flow of power through the network, i.e. 10 Ampere for a washing machine, and
- short circuit level – system strength, measured in GVA or Gigavolt-ampere, strong grids with thermal synchronous units have 20-40 GVA, weak grids with high wind and solar have <5 GVA.
One main reason why coal, gas, nuclear, and hydro remain central to electricity grid systems – which can be considered amongst the most complex systems on Earth – is that thermal power plants provide the physical stability that electrical grids require to operate reliably and their high power price capture rate illustrates this. Large, heavy mass, synchronously rotating generators supply the five fundamental characteristics mentioned above, that maintain grid stability. Thus, removing synchronous generators from the system and adding “digital generators” such as wind, solar, and batteries, reduces fault level and system strength. The 2025 blackout experienced in Spain is a perfect example of the exact problem faced. See my blog post on this here.
My quantitative electricity cost analysis in the next chapter adjusts standard LCOE for solar capture rate and adds selected conservative system costs. My electricity cost estimates for Germany does NOT equal FCOE, my estimates are still lower. A qualitative summary of the system costs of different technologies can be seen in Figure 6.
In my estimation, for Germany’s 2026 electricity costs, I am conservatively assessing system cost for wind and solar in Germany at a mere 75 EUR/MWh, without taking the overbuild into account. This is a fraction of what Mitch Rolling and Isaac Orr are estimating in Figure 2. But it doesn’t really matter, the point still comes across.
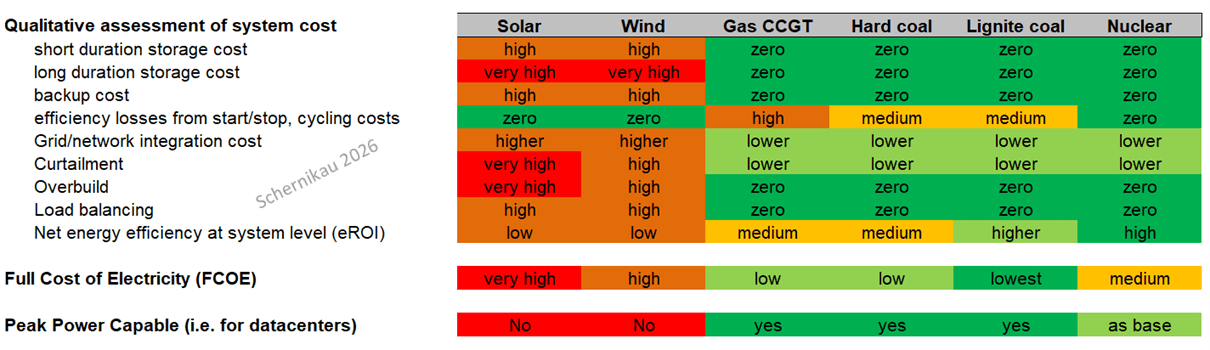
Figure 6: Qualitative assessment of system costs for electricity systems | Source: Schernikau
5. Germany’s 2026 electricity cost
“The function of supply in electricity markets is not to generate electricity…
… but to provide a specified amount of electricity to a specific place at a particular time.” (Idel 2022 [7])
Now that we discussed capture rates and system costs, I would like to give you a very simplistic illustration of Germany’s 2026 cost of electricity. Remember that Germany has much higher fuel costs than the US as coal and gas are mostly, but not solely, imported. So each country would have to adjust this analysis to its own resources and circumstances.
Figure 7 and the performed analysis show clearly that in Germany, domestic lignite has by far the lowest cost, totaling about 35 EUR/MWh without CO2 and 120 EUR/MWh with CO2. Lignite is also the cheapest even when including CO2 cost. Coal, gas, and nuclear follow closely at 81, 95, and 133 EUR/MWh respectively without CO2 (Figure 7). Solar is the most expensive, at 374 EUR/MWh in Germany. Even without adding the additional system costs and even without adjusting for the solar capture rate, solar remains the most expensive at 128 EUR/MWh excl. CO2 (see Appendix 1), with wind following closely.
Wind and solar costs are highly dependent on CAPEX, which is underestimated because overbuild costs are not considered in my analysis. Please note that Germany now already has installed wind and solar capacity equal to 2.5 times its total peak demand. One may also argue – as I do – that the overbuild cost is part of the system cost and not part of the CAPEX directly, I will leave that up to you.
Note on CO2 cost: my analysis shows both the cost with and without CO2 cost. I am of the opinion that the CO2 cost is nothing but an indirect subsidy for wind and solar as (1) theoretical CO2 savings from switching from coal/gas to wind/solar do not have any measurable positive environmental impact at macro level (see “Carbon” Capture Utilization & Storage (CCUS) blog) and (2) the collected CO2 tax is often spent on subsidizing additional wind/solar systems or for other government purposes.
For the record, i am not dismissing the need to reduce the environmental impact of our energy systems, quite the contrary. We need to continue to research and install newest power plant and other technologies.
My analysis includes the standard LCOE components – CAPEX, fuel cost, land lease, O&M – adjusted for the average Germany power price capture rate from Prof. Hirth. I added conservatively low system costs relevant for wind and solar totaling to a mere 75 EUR/MWh. All assumptions are detailed in the appendix and I also attached a link to a google sheet so that you can play with all assumptions (red numbers) and see the effects for yourself.
I caution that my simplified illustrative analysis is still incomplete and does not include all costs for estimating the Full Cost of Electricity FCOE. It is an underestimation, consider it a lower boundary. I also do not claim accuracy, the big picture is what matters more. Examples of direct or indirect costs that are NOT included are: CAPEX adjusted for overbuilding and net efficiency costs, efficiency degradation, financing reality, decommissioning/disposal, lifetime environmental costs, net energy efficiency (eROI) considerations, material input per unit of service (MIPS), and more. Please see the Appendix.
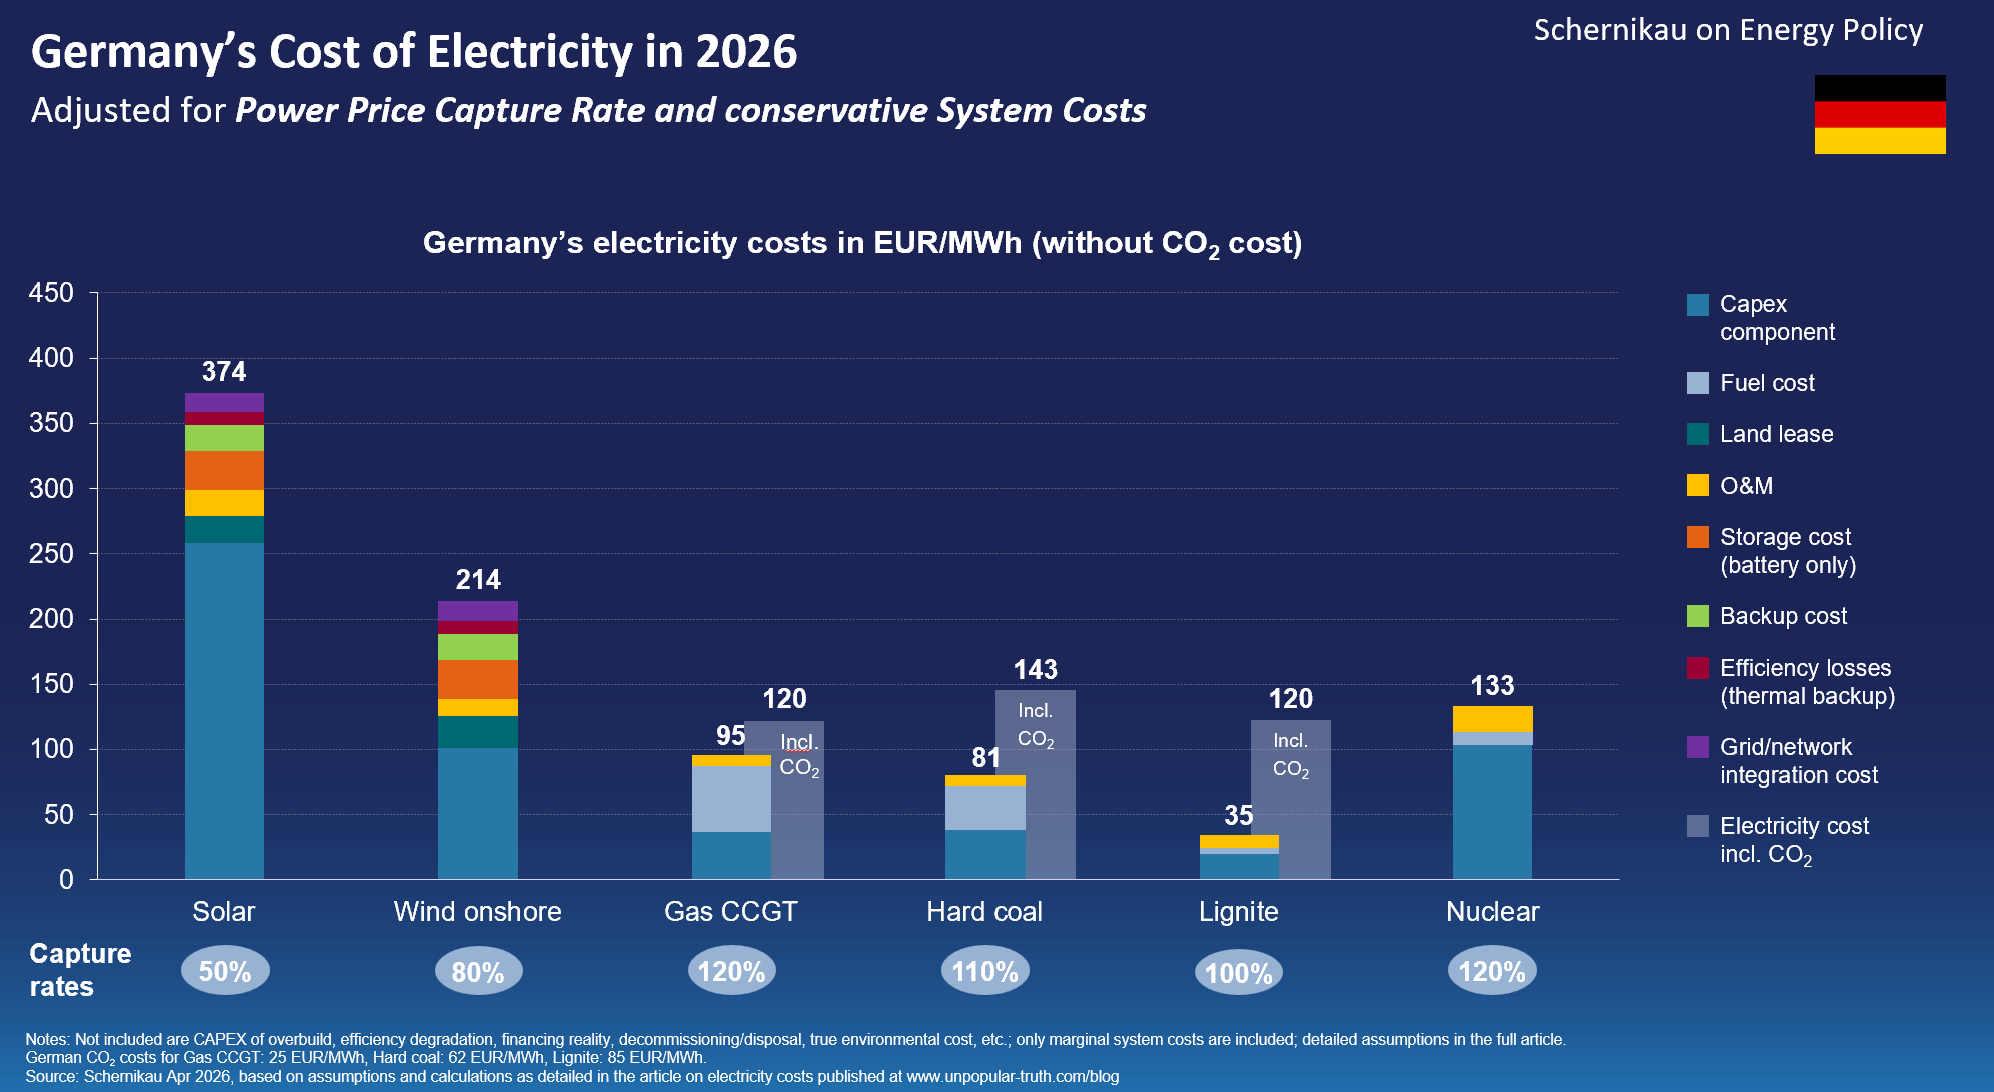
Figure 7: Germany’s 2026 cost of electricity | Source: Schernikau based on assumptions detailed in the Appendix
Summary
We have been debating electricity costs for decades, yet we still lack a clear, reliable measure of what electricity truly costs society. Widely used metrics such as LCOE focus on individual technologies but ignore the broader system they operate in which skews the numbers we are after. More complete approaches such as FCOE show a different picture: the cost of electricity is not just about generation, but about the entire system required to deliver reliable power, which in my opinion, gives us a clearer, more accurate view of the numbers.
This matters because energy costs directly shape human well-being and economic growth. High costs increase hardship and slow industrial development everywhere, not just in poorer countries. At the same time, global energy policy remains conflicted. Governments push for rapid electrification through wind and solar while also calling for continued investment in conventional fuels to ensure security and independence.
Even institutions such as the OECD and UNECE now admit that as the share of wind and solar increases, total system costs rise. These technologies require additional infrastructure such as vast overbuild, backup capacity, storage, and expanded grids, while also reducing system stability and market value illustrated by declining capture rates. In other words, the more wind and solar are deployed, the more complex and costly systems become.
Germany serves as a wonderful real-world example. Despite massive investment and wind and solar capacity, now far exceeding peak demand, total system costs remain high and continue increasing and according to chancellor Merz in early 2026 still “lacks sufficient electricity generation capacity”. This highlights a key point I am making which is… the cost impact of any technology cannot be judged in isolation nor ignored. It must be evaluated within the system it depends on and reshapes so that we can see the full picture.
In Germany, domestic lignite is by far the lowest cost technology at 35 EUR/MWh to generate electricity. Coal, gas, and nuclear are not far behind.
Solar (over 370 EUR/MWh) and wind (over 210 EUR/MWh) are already the most expensive.
The central takeaway is simple and often overlooked. Electricity is not just about producing kWh, but rather about delivering peak-power service, reliable, grid-ready power at all times 24/7/365. Any serious discussion about cost must reflect this reality.
When considering that domestic Lignite is the cheapest energy source in Germany where coal, gas, and nuclear costs are similar even when including misleadingly applied CO2 costs (see my article The Dilemma of Pricing CO2) and solar is over 10 times the cost of domestic lignite without CO2, one starts questioning the motivation of the so-called “Energiewende”… I always ask, transition to what exactly?
“An “energy transition” that ignores system costs will ruin a country, that it pretends to save…” – Ms Katherina Reiche. I could not have said this better myself.
I leave you with this question… if electrification using wind and solar is the most expensive approach, and its cost increases as their share in the system grows, why are we still so aggressively investing in this approach?
This Blog was last updated on 30 April 2026, most significant change is the reduction of lignite fuel cost from 10 EUR/MWh to 5 EUR/MWh, additional sources were added.
Links and Resources
[1 ] BMWE 2026, Bundesministerium für Wirtschaft und Klimaschutz, “Reiche: Ehrlich und effizient – die Energie-Strategie für Deutschland.” April 2026. (link)
[2 ] UNECE 2025, Understanding the Full System Cost of the Electricity System, 2025 (link)
[3 ] OECD NEA 2024 “System Cost Exec Sum” 2024. (link)
[4 ] OECD NEA 2018: The Full Costs of Electricity Provision | En | OECD.” June 2018. (link)
[5 ] OECD NEA 2019: The Costs of Decarbonisation: System Costs with High Shares of Nuclear and Renewables. OECD, 2019. (link)
[6 ] IEA: Power – Breakthrough Agenda Report 2025 – Analysis. 2025. (link) and and The Guardian: Birol ‘The Damage Is Done’: Global Oil Crisis Has Changed Fossil Fuel Industry for Ever, IEA Chief Says, April 2026. (link)
[7 ] Idel 2022: Levelized Full System Costs of Electricity. Energy 259 (November 2022): 124905. (link)
[8 ] Schernikau 2024 Energy Trilemma – The Unpopular Truth. March 2024. (link)
[9 ] Schernikau et al 2022 “SSRN: Full Cost of Electricity ‘FCOE’ and Energy Returns ‘eROI.’” Journal of Management and Sustainability 12, no. 1 (2022): p96. (link)
[10 ] EWI: Ausgaben für das Stromsystem in Deutschland. EWI, 2026. (link)
[11 ] Hirth 2026: The Cost of Power Supply, February 2016 (link)
[12 ] Schernikau, Lars. Blog 16: Cyber Security and Critical Infrastructure. March 2025. (link)
[13 ] Orr, Isaac, and Mitch Rolling. “EnergyBadBoys: On LCOE – Why Nuclear Is Cheaper than Wind and Solar.” Substack newsletter. Energy Bad Boys, July 2024. (link)
[14 ] Schernikau, Lars. Blog 8: Nature’s Influence on Solar and Wind Power Generation – The Unpopular Truth. July 2024. (link)
[15 ] Hirth 2026: Solar Capture Rate, February 2026. (link)
[16 ] Mariutti 2025, The Limits of the Current Consensus Regarding the Carbon Footprint of Photovoltaic Modules Manufactured in China: A Review and Case Study.” Energies 18, no. 5 (2025): 5. (link)
[17 ] Wanner, Brent. “IEA: Is Exponential Growth of Solar PV the Obvious Conclusion?” IEA, February 2019. (link)
[18] Schernikau, Lars. Blog 15: Where the Wind Blows – The Unpopular Truth. February 2025. (link)
[19] Hirth 2013: The Market Value of Variable Renewables.” Energy Economics 38 (February 2013): 218–36. (link)
[20] Schernikau, Lars. Blog 7: The Dilemma of Pricing CO2 – The Unpopular Truth. June 2024. (link)
[21] IEA Global Energy Review Apr 2026, p9; on peak power IEA World Energy Outlook 2024, p43; on data center uptime IEA Energy and AI Apr 2026, p52 (link) (link) (link)
[22] Yale E360. Amid Energy Crisis, Chinese Solar Exports Double, April 2026. (link)
[23] Energy Connects, Taiwan Pivots to Coal Power as War Disrupts Global LNG Market, April 7, 2026. (link) and Bloomberg, China Revives Coal-to-Gas Projects as Energy Security Frays, Bloomberg.Com, April 20, 2026 (link)
[24] Cost of lignite fuel in Germany: seeArgus: Lignite Displaces Gas in German Power Mix | Latest Market News, October 2024. (link)
Appendix 1: Assumptions and details to Lars’ 2026 electricity cost for Germany
The detailed assumptions to my simple calculation can be accessed here at a public google sheet and you can adjust all numbers in red to your liking and see how the picture changes.
Basically, I use defensible LCOE numbers based on publicly available information and estimates. I then adjust those LCOE numbers for the power price capture rate and add conservatively low additional system costs relevant to wind and solar. Those system costs, I do NOT adjust for the capture rate.
- CAPEX component is basically taking the investment cost and dividing it over the lifetime and MWh generated. Capex is missing the cost of overbuild for wind and solar and simplifies or underestimates “net efficiency costs” (inverter losses, wake losses, maintenance downtime, etc)
- CRF – capital recovery factor: If I invest X today, what fixed annual payment over N years (at WACC r) is economically equivalent? This is one of the quiet reasons why wind/solar look cheap in LCOE studies: analysts often combine short lifetimes + optimistic WACC + generous net load factors (combination of utilization x natural capacity factors). Change any of those and the economics deteriorate fast.
- Net load factor NLF equals natural capacity factor x utilization: realistic net load factors after adjusting for wake effects, and various other losses to get the net kWh generated. It is basically the average % of time that the plant delivers kWh that can be fed into the grid, for Germany.
- WACC: weighted average cost of capital. Very important number, if I were to assume a low WACC of 2% for solar (as some studies do), then the LCOE would be 30% lower for solar.
- Fuel cost, land lease, and O&M operations and maintenance are self-explanatory. For lignite’s low fuel cost please refer to Argus (working assumption, 2021): €2.85/MWh, BNetzA via Argus 2024 (see [26]): ~€3/MWh, Öko-Institut (2017): €3.60/MWh fuel + €2/MWh variable O&M, Wuppertal Institute citing Öko-Institut: €4/MWh.
- CO2 cost are estimated based on Germany’s prevailing CO2 price and penalty charged to coal and gas. Such CO2 pricing is unscientific and economically harmful as explained in my article The Dilemma of Pricing CO2
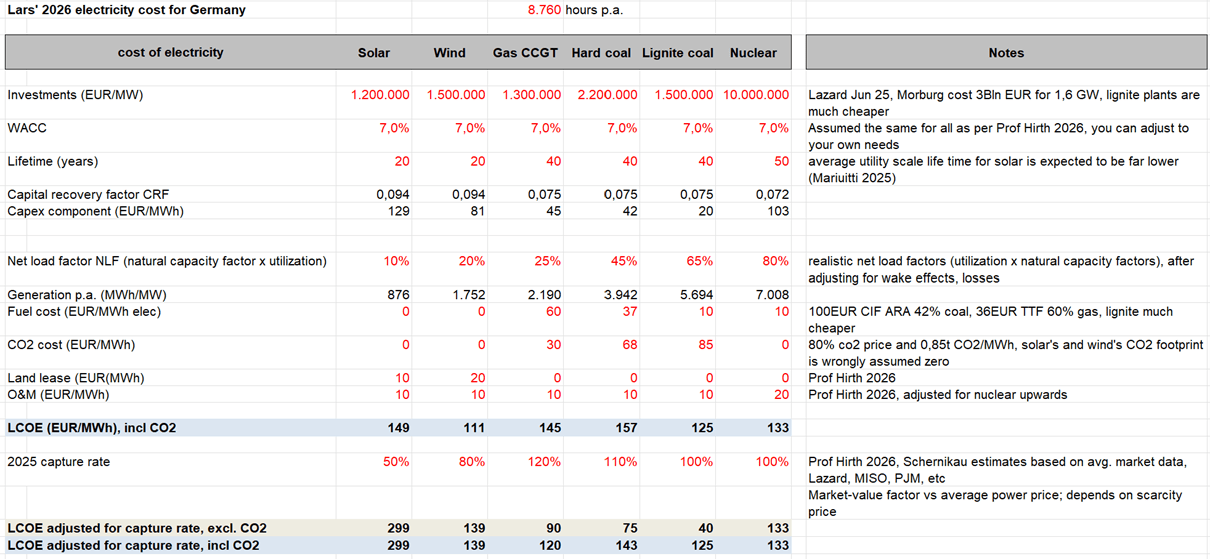
Figure 9: LCOE calculation for Germany | Source – Google Sheet
Further details and assumptions of system costs are given here
- Backup/capacity costs: cost of having firm capacity available when needed. Wind/solar need dispatchable backup (gas, coal, hydro, etc.), even if rarely used it still must be built and maintained, typical order of magnitude: 10–40 €/MWh (at system-level) depending on penetration can be far higher. This cost increases exponentially the less the backup or capacity is used. Here is a short 2min video of a German gas fired-power station being used only a few days a year. Source | Ein Gaskraftwerk in Frührente | Extra 3 | NDR – Bavaria. 2019.
- Storage costs: batteries (short-term) or seasonal storage (long-term), Typical batteries alone: 20–80 €/MWh added system cost, long duration energy storage (LDES) costs are far higher (often ignored for a reason)
- Grid costs: Network integration and transmission costs, wind/solar require long-distance transmission (north → south) and distribution upgrades, thermal plants usually are fully grid-aligned already, conservatively additional 10–30 €/MWh for high wind/solar systems. Much more research is required here
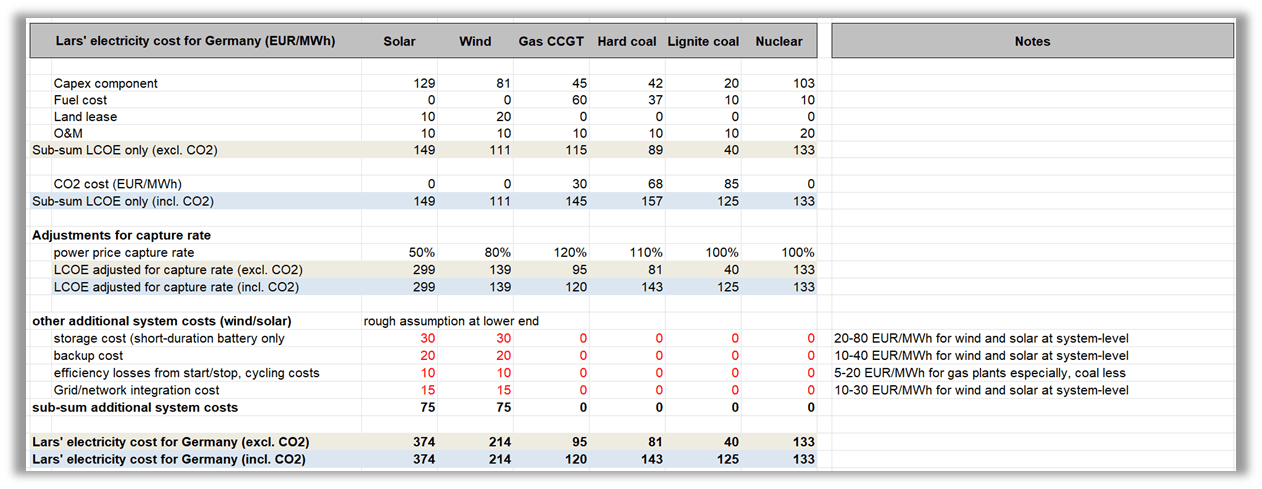
Figure 10: Lars’ electricity cost for Germany (EUR/MWh) | Source – Google Sheet
Various costs are not considered in “Lars’ 2026 electricity costs for Germany”, here are some examples
- Overbuild: discussed above already, the overbuild for wind and solar is already reaching very high numbers in Germany and will grow further.
- Curtailment: wind/solar are increasingly curtailed, the real cost per delivered MWh increases by typically 5–20 €/MWh at higher penetration. This element we may conservatively assume is included in the capture rate, though I would doubt the full cost is covered. The economic contribution from each additional solar panel or wind turbine continuously reduces.
- Efficiency degradation: especially but not only for gas, for instance, 60% gas efficiency only applies at optimal load. At 20–30% load it is far lower making 60 €/MWh gas fuel cost too low if used as a balancing plant
- Financing reality: the cost of financing may be higher for nuclear and lower for wind and solar (which would also be a form of indirect subsidy.) Also not included are construction delays especially for gas and nuclear.
- Decommissioning, disposal: the low energy density and short operational lifetime of wind and solar means that their decommissioning and disposal costs are much higher than those for coal, gas, or nuclear. I discuss coal ash in my article on coal here
- Lifetime environmental costs from material extraction, upgrading, transportation, processing, manufacturing and input energy required (eROI component and MIPS Material Input per Unit of Service). Also the lifecycle CO2 footprint for wind and solar is not considered (see Mariutti 2025, [16])
Appendix 2: Further clarifying details and definitions
- VRE = Variable “Renewable Energy” = wind and solar
- UNECE = United Nations Economic Commission for Europe
- OECD = Organisation for Economic Co-operation and Development
FCOE: Detailed explanation of the Full Cost of Electricity, FCOE
Schernikau et al 2022 [9] details FCOE as per Figure 3 and 11 above and explained below
Note on VALCOE: IEA’s Value Adjusted Cost of Electricity [17]
The IEA had also introduced already in 2018/19 what they refer to as Value-Adjusted Cost of Electricity VALCOE. The VALCOE builds on the LCOE metric by including three additional considerations of value in power systems, (a) energy, (b) capacity and (c) flexibility. However, VALCOE still does not capture the full cost as it does not capture the overbuild or full cost of providing underutilized backup or storage systems nor any site-specific grid integration costs or system reliability contributions, such as essential ancillary services. It also does not include environmental costs.
Notes on LACE: Levelized Avoided Cost of Electricity (from UNECE [2], p15)
The levelized avoided cost of electricity (LACE), developed by the U.S. Energy Information Administration (EIA), approaches the value evaluation from another direction (EIA, 2018). LACE estimates the cost that would be incurred if the electricity generated by a new project had to be replaced by alternative sources, offering a measure of its market value.
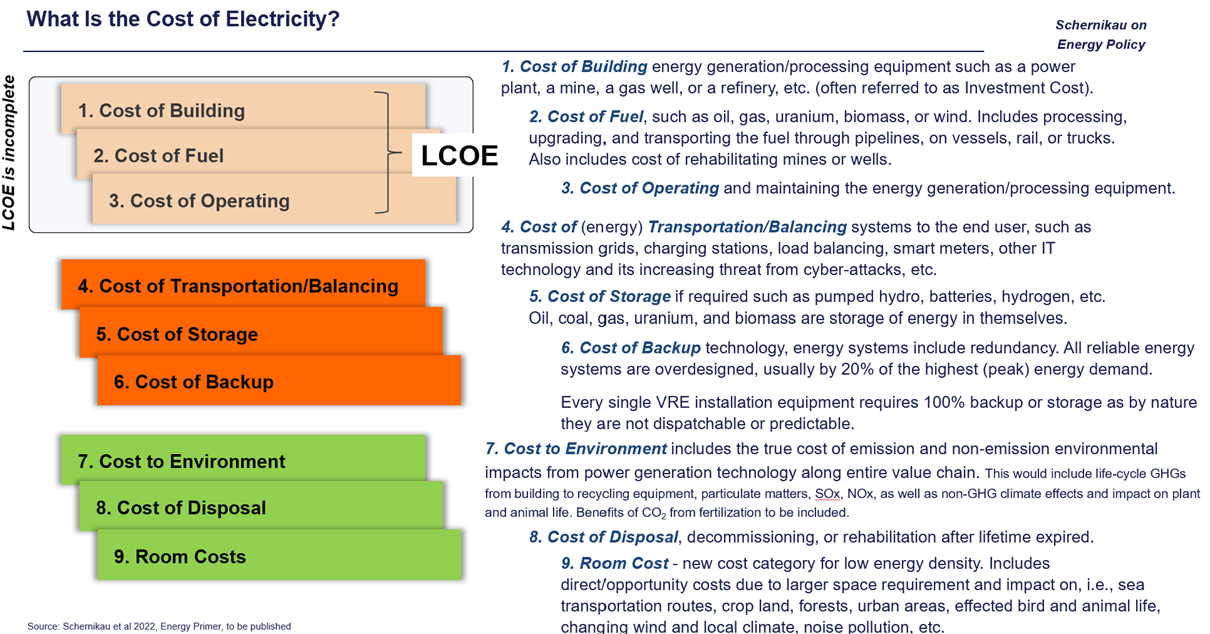
Figure 11: Lars’ 2026 electricity cost for Germany | Source – Schernikau et al 2022
Since LACE varies by location due to differences in resource availability, fuel costs, and market conditions, it is useful for location-specific assessments. A generation asset is generally considered economically viable when its LACE exceeds its LCOE at a given time and place, as this suggests that its market value outweighs its production cost. However, real-world investment decisions are more complex than a simple LCOE-to-LACE comparison. Factors such as grid integration costs, regulatory incentives, and long-term market uncertainties influence economic feasibility. Nonetheless, the difference between LACE and LCOE provides a useful high-level indicator of a power plant’s economic attractiveness.
Notes on Lazard’s LCOE+ (from UNECE [2], p16)
Lazard proposes the levelized cost of firming variability (LCOE, including firming), which takes into account the actual firming costs for the particular grids analyzed (Lazard’s LCOE+, 2025). Lazard offers two approaches to add “firming costs” to make the LCOE of wind and solar more comparable to the LCOE of firm power plants. In the first approach, Lazard adds storage to a solar plant (with lithium-ion battery configuration of 50% of the capacity of the solar PV plant and a 4hour duration). However, this approach falls significantly short to making the ‘firmed’ solar plant equivalent in the services provided by, e.g., a firm gas or coal plant. In the second approach, Lazard incorporates part of the cost of a natural gas peaking plant into the LCOE of wind and solar to bring the Effective Load Carrying Capacity (ELCC) of the wind or solar plant to 100%. Arguably, this combination is more ‘firm’ than a solar or wind plant alone, but still would not provide the same grid services as a firm power plant (EPRI, 2025).
Notes on LCOS: Levelized Cost of Storage
Is defined as the total lifetime cost of a storage system divided by the total energy discharged over its lifetime. LCOS answers What does it cost per MWh to take electricity, store it, and deliver it later? It does NOT answer What does storage cost the entire power system?
LCOS ignores, system operator costs, reserve requirements, real-time balancing infrastructure, cost of overbuilding generation, or residual curtailment losses. The true system cost of storage can be multiples of LCOS.