

The energy “nobody” counts
Embodied energy – The first step in understanding eROI
Dr. Lars Schernikau
Content
Embodied energy is at the core of everything we hold in our hands, everything we consume and certainly electricity. Electricty “only” makes up about 40% of primary energy we require for our lives, but is the most complex form of energy we use. As we move towards “electrification” trying to reduce non-electric energy consumption, right or wrong, this embodied energy, not only of every product we consume but of our electricity generation systems, needs to be better understood.
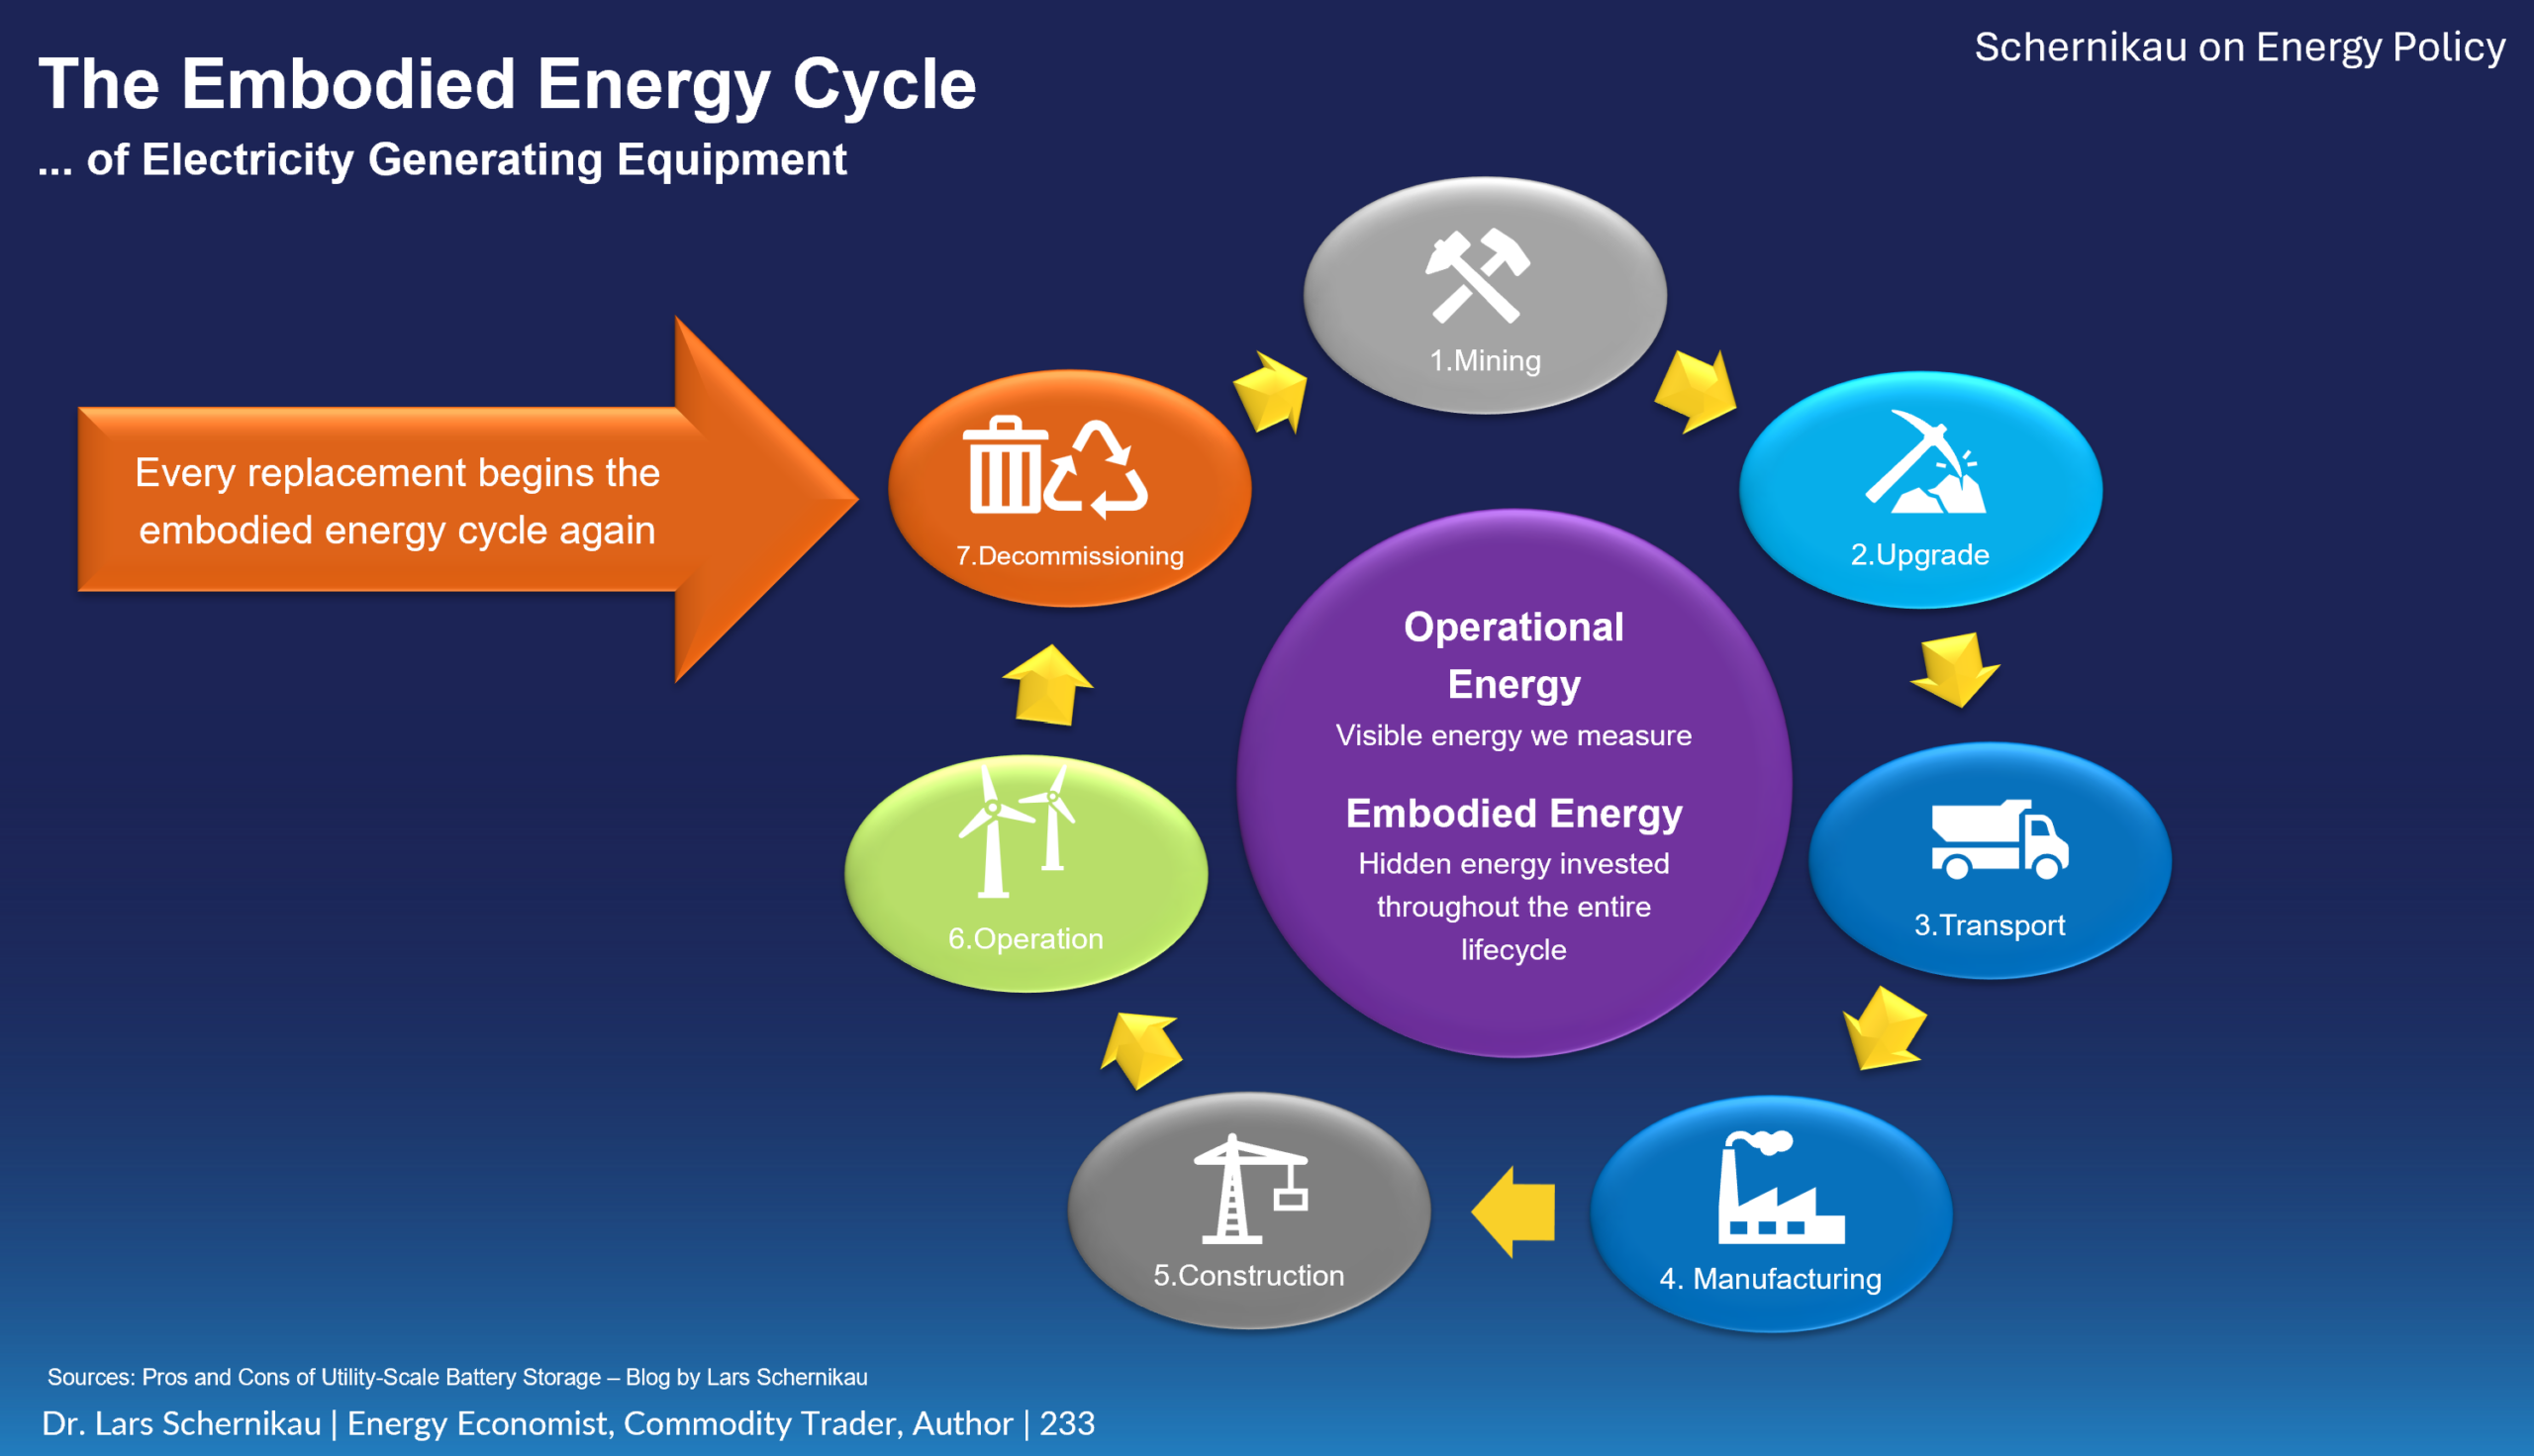
Figure 1: The Embodied Energy Cycle … of Electricity Generating Equipment
- Why every energy system has a hidden energy bill
When we talk about energy systems, we usually focus on what happens after they are built. We consider how much electricity they generate, how efficient are they, we pay close attention to how much carbon dioxide they emit and we analyse how much they cost to run.
These may all be important factors, but they all begin at the same point and that is only after the infrastructure already exists.
Long before the first kilowatt-hour reaches our homes, factories and hospitals, an enormous amount of energy and raw materials have already been consumed building infrastructure, that should be considered as part of this energy puzzle. Raw materials must be mined, metals refined, upgraded and transported, steel manufactured, concrete poured, many components assembled and equipment transported all for the construction process.
Only after energy generating infrastructure is built, can such an energy system begin producing electricity.
This is an example about what engineers call embodied energy (sometimes embodied energy or “grey” energy). For energy systems, embodied energy summarizes the energy required to build an energy system before that system produces any useful energy in return. Every produced item you hold in your hand has an embodied energy, every metal, every piece of wood, and certainly the food on your table. That embodied energy comes from a) the embedded energy of the energy system that was used to build the product in the factory and b) from the raw materials the factory was fed with.
Embodied energy is neither theoretical nor optional. It is an unavoidable consequence of constructing and maintaining physical infrastructure. Every tonne of steel, every cubic metre of concrete, every kilometre of transmission line and every battery cell every solar panel, every wind turbine requires energy before it can contribute to electricity generation. Yet these upstream energy requirements are seldom considered resulting in discussions about energy efficiency and decarbonisation often only evaluating the energy that is visible while overlooking the energy invested before the first kilowatt-hour is produced.
This distinction and embodied energy becomes more important as we move from high energy density (nuclear, oil, coal, gas) to low energy density (wind, solar, biomass). The more infrastructure required to “produce”, condition, store, support and deliver electricity, the greater the contribution of embodied energy to the overall energy balance ((Figure 2 only shows metals as per Department of Energy, not all the ore required), see eROI). Ignoring these upstream energy investments does not eliminate them, it simply shifts them outside the scope of the analysis. Out of sight, out if mind.
The objective of this article is to examine an often overlooked component of every energy system which is – the energy required to build, maintain and repeatedly replace the infrastructure upon which electricity generation depends. A more complete understanding of embodied energy provides a broader perspective on energy efficiency, resource requirements and the full life-cycle implications of different technologies.
But construction is not the end of the story, as every energy system must be operated, maintained, repaired and, eventually, decommissioned. As infrastructure reaches the end of its useful life and the components wear out, equipment must be dismantled, recycled or disposed of, often requiring yet another round of transport, processing and manufacturing.
In other words, every energy system follows a complete life cycle. It begins with:
- mining
- upgrading
- transporting
- processing
- manufacturing
- operation
…and comes full circle with decommissioning and disposing of infrastructure, with large amounts of energy required at every stage along the way. Of course, we recycle as much as we can but also recycling takes energy, often more than we think making the entire recycling process an net-energy sink, i.e., recycling may take more than “making it new”.
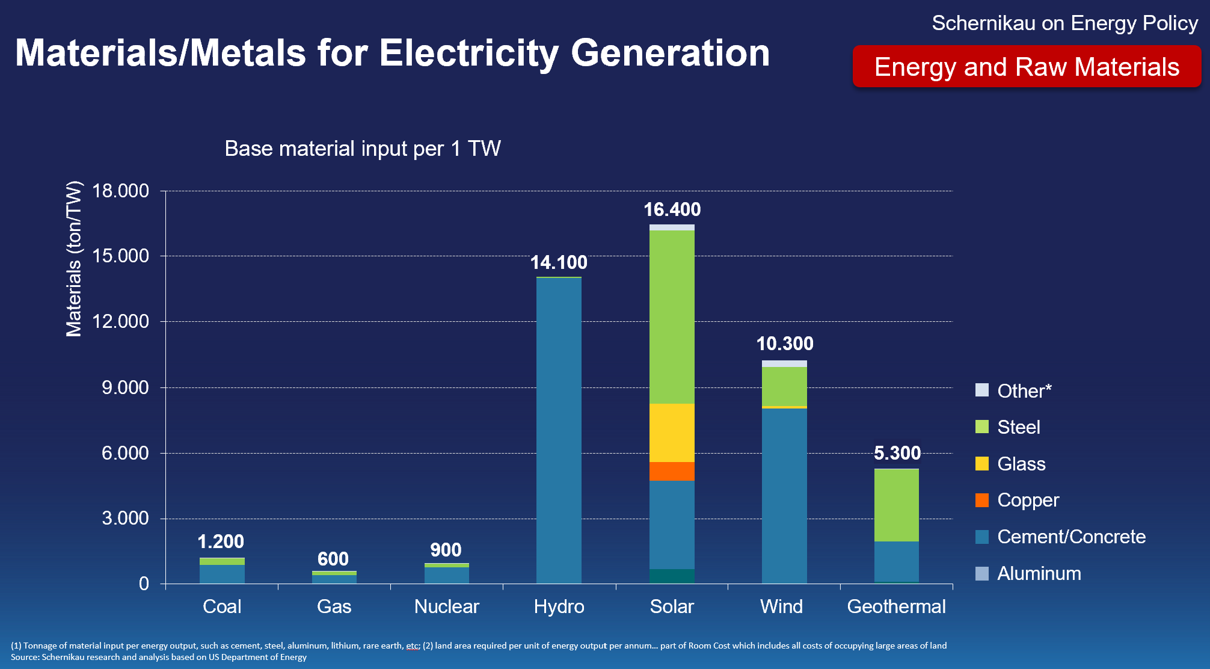
Figure 2: Materials/Metals required for installing power generation capacity
2. Every energy system starts as an energy consumer
We often think of power stations as generators of electricity, but in reality, every power station, every piece of equipment first consumes energy. It sometimes may take years before that “invested” energy is returned in the form of new useful energy “produced”.
Before a turbine can turn or a solar panel can generate electricity, someone has already mined the quartz sand and iron ore, refined the copper, manufactured the steel, produced the cement, built the roads, transported the equipment and assembled the entire system… even grew the food for the construction worker.
In other words, every energy technology is an energy consumer before it becomes an energy producer and that investment is paid upfront. But unlike the fuel consumption during operation (i.e. coal, gas, uranium), it is rarely discussed.
I suppose it is because operational energy is relatively easy to observe, but tells only half the story. It is also because, historically, that upfront energy investment was relatively small compared to the output. We also see how power plants generate electricity, we consume fuel, heat is produced, we measure pollution and CO2, but embodied energy is different.
It is hidden inside industrial supply chains, inside blast furnaces producing steel, refineries producing aluminium and copper, ships transporting equipment across oceans, factories manufacturing batteries, transformers, cables and generators.
The electricity produced over the lifetime of an energy system is only one side of the equation. The energy required to create that system is the other and it becomes more relevant as we are moving towards less energy efficient systems.
Now here another fact to consider – The embodied energy bill does not end when construction is finished and this is perhaps the biggest misconception – that embodied energy is paid only upfront. It is not! Everything ages, steel corrodes, electronics fail, mechanical equipment wears, concrete cracks, materials fatigue and the list goes on. Infrastructure must be repaired, refurbished and eventually disposed and replaced and please keep in mind that every replacement requires another round of mining, refining, manufacturing, transport, construction… as the embodied energy cycle begins again.
The lifetime of an energy system becomes crucial, compare a nuclear power station that may operate for 60 years to a solar panel that is destroyed in a hailstorm in year 8 of operation.

Figure 3: Embodied energy as per Ashby [3]
3. Embodied energy and ore ratios of common materials
We understand that every material has an energy footprint, how much? Well, that is a tougher question. When reading the public press, scientific articles such as Gutowski et al “The energy required to produce materials” [1] or famous books such “Sustainable Materials without the Hot Air” [2] or Ashby’s “Materials and the Environment” [3], embodied energy is often discussed and quantified.
The boundaries considered, however, are key. Should we include the energy it took …
- to build the road to the mine?
- to feed the worker working in the factory, and her children and grandparents?
- to build the school the mine manager attended to learn mining engineering? How about the teachers?
- to produce the steel that it took to build the factory that produced the steel, and how about that original factory producing the original steel?
You get the point, you will probably NEVER get a true picture of all embodied energy because it becomes too complicated if you cast the boundaries more “correctly”, that is very wide. Prof. Hall has discussed this in many of his papers and books [4].
Therefore, generally, the boundaries are relatively narrow usually counting only the primary energy input directly consumed by the mines and factory. Even transportation is often left out. Therefore, I urge you to be critical, the true embodied energy is usually underestimated.
One thing we all can agree to, a product that has a high embodied energy such as gold, silver, or silicon will in general be more expensive than a product that has low embodied energy such as wood or cement. On this scale alumina and steel appear very simple compared to wafer-grade silicon for solar panels (Figure 3).
Another point is that it doesn’t only take energy to build materials, but it takes raw materials, such as ore products. Especially for metals that is relevant. A low ore ratio means it requires a lot of earth moving and processing to extract one kilogram of valuable metal, think of gold (Au) vs iron (Fe). Which requires less earth moving per kg?
For instance, to build 1 GWh of utility scale battery systems requires not only 450 GWh of input energy, or embodied energy, but also 0.7 Mio tons of ore product to be mined, upgraded, transported, processed, and manufactured (see Figure 1). Remember that we are looking at the “entire rock” disturbed to produce the metals required, in this case excluding overburden.
The table below shows, typical embodied energy and ore ratios for a few selected materials. All are rough approximations for guidance only, see also Figure 3
| Material | Embodied energy | Mined ore/1kg of metal |
|---|---|---|
|
Lithium |
200 kWh/kg |
200-400+ kg |
|
Aluminum |
50+ kWh/kg |
6-8 kg |
|
Copper |
up to 50 kWh/kg |
200+ kg |
|
Steel |
5-20 kWh/kg |
2.5 kg |
|
Cement |
1 kWh/kg |
1.5+ kg |

Figure 4: Embodied energy and price correlate [based on Gutwoski et al 3]
4. EROI – because every investment should show a return
Timespan also matters and is key when discussing the subject of embodied energy as not all energy systems follow the same replacement cycle. Some infrastructure is designed to operate for many decades and others consist of multiple components, each with its own operational lifetime and replacement schedule.
This also introduces another important concept namely the Energy Return on Investment (eROI, sometimes also eROeI or energy return on energy invested, or net energy efficiency).
The eROI measures how much useful energy a system returns over its lifetime relative to the total energy required to build, operate, maintain and ultimately decommission and dispose it. While methodologies differ, they all seek to answer the same fundamental question: How much energy do we get back for the energy we invest?
Embodied energy forms a significant part of that initial investment. The larger the upfront energy requirement, or the more frequently that investment must be repeated, the greater its influence on the overall energy return. The eROI represents the return.
eROI = total energy “produced” over the entire lifetime
total energy invested (incl. embodied energy)
A conventional coal-fired power station requires a certain upfront investment in materials and construction, yes, but once commissioned, the plant itself can often operate for forty to sixty years supplying us with electricity. Of course, it takes energy to mine and transport the coal and operate the power plant which goes into the eROI calculation.
Nuclear power stations require an even greater initial investment in materials and construction. Yet they boast a continued and reliable generation capacity of sixty to even eighty years or more, allowing that initial investment to be spread across several generations of electricity production and while the fuel (uranium) has a high embodied energy per kg, we don’t need much of it.
When we look at other technologies which follow a “renewable” engineering pathway, we see these lifespans shorten dramatically.
A modern solar or wind installation is not simply about the turbines and solar panels we see that may operate for 10 to 25 years. It also requires additional, otherwise not needed, interconnected systems of foundations, towers, support structures, inverters, transformers, substations, transmission infrastructure and, increasingly, utility-scale battery storage or other storage and of course backup. As this list goes on, consider that each component with its own operational lifespan, require replacement, some long before the generating asset itself reaches the end of its service life.
Where battery storage is included, another replacement cycle is introduced into the mix. Current utility-scale lithium-ion battery systems typically require substantial replacement after roughly a decade of operation under real-world conditions, remember the 450 GWh of input energy per 1 GWh of utility-scale battery system (see the The Battery Storage Delusion).
As you can see, with every replacement starts another embodied energy cycle and this is where the discussion becomes an interesting one.
Should we measure the energy we see… or all the energy we use? Modern energy policy places considerable emphasis on operational performance, and rightly so (Figure 3).
But they fail to explain how much energy society had to invest before the system produces its first unit of electricity. Not to mention how much additional energy will be required as components reach the end of their useful lives and are often disposed, sometimes partially recycled.
If one system requires repeated cycles of mining, refining, manufacturing and replacement while another operates for decades before major reconstruction is needed, wouldn’t you agree that those differences should form part of the comparison?
One note, the eROI or net energy efficiency discussions does NOT consider the value of the kWh generated. For instance, in 2025, 1 kWh of solar power in Germany was valued by the market at only 50% of the average. Why? Simple, because a kWh of solar power generated intermittently when the sun shines (everywhere) does not help me as much as a kWh generated on demand by a gas-fired power station. Also, for the grid, the quality of the digitally generated solar kWh is not as high as the quality of heavy mass, inertia-based electricity generated by a coal or gas-fired turbine spinning at the correct frequency (Rethinking the cost of electricity)
A final note, all raw material-based energy systems have continuous declining eROI as it becomes more difficult and expensive to mine as geology changes and the easy-to-mine-raw materials have been extracted. All energy systems continue to increase eROI as technology and efficiencies improve. 50-year old coal-fired power stations may run at 30% power plant efficiency, the most modern ones run at 45+% efficiency, that is a 150% improvement! An improvement that directly translates to economic and environmental efficiency. At the same time mining the coal may have gotten more energy intensive as easy geologies have been mined first.
Modern society requires a minimum inherent net energy efficiency (eROI) to function. Different activities have different minimum eROI requirements. More advanced societal activities require a higher eROI. Flying to the moon may be one of the most advanced activities requiring highest possible net energy efficiency and energy density to become possible.
As society advances, higher eROIs are required, think of AI.
Today, on average, energy economists assume that society requires eROI ≈ 8 to 11 to sustain itself. Anything below would make things “worse” and anything above would make it “better”. Euan Mearns [see also 11] introduced the “Net Energy Cliff” graph around 2008 (at eROI around 5-10), building on the net-energy/EROI framework developed by Howard Odum and Charles Hall.
For more details and details and more sources on the subjec The Unpopular Truth… About Electricity and the Future of Energy Chapter 3.3 on eROI.

Figure 5: Net energy efficiency or eROI
5. On eROI and raw materials: What must be invested to deliver 1 GW of “continuous” solar power?
To calculate the eROI for solar modules is difficult and not clear-cut. Mariuitti [5, 6] has explained in detail the shortcomings of standard ecoinvent and various other studies on embodied energy that largely rely on this same Swiss ecoinvent. The consumption of chemicals, the (largely Chinese) electricity mix and of course the boundaries used are the key problems. The required heat energy is usually underestimated. The ancillary systems required for the entire solar installation are usually not considered. Decommissioning and disposal are largely “forgotten” and the operational lifetime of wind and solar overestimated.
In my widely published and republished article “Coal’s Importance for Solar Panel Manufacturing” I covered the subject of primary energy required for solar panels already in some detail. There simply is not a single solar panel in the world that was possible without coal.
The Al Dhafra, UAE project I mentioned in a previous blog – Can solar and wind + batteries really provide 24/7/365 electricity? combines 5.2 GW of solar capacity with 19 GWh of battery storage that is promised to deliver up to 1 GW of so called “continuous” electricity. The IRENA [7] recently used this project as an example do discuss “firm wind and solar power”. Masdar, the developer of Al Dhafra, is the Abu Dhabi Future Energy Company. The system cost about 6 Bln USD for this 1 GW of “reliable” power generation and will go into operation in 2027. The cost of al Dhafra is far higher than a truly reliable 1 GW coal or gas power plant [9]. Is the output better, or is it more efficient?
As an example, I am not trying to make things perfect here, I am using Al Dhafra. The calculation will give you a sense of the net energy return or eROI of the UAE Al Dhafra solar project with 19 GWh of batteries and 5.2 GW of installed solar inappropriately called 1 GW “24/7 electricity”, which it is clearly not. The 5.2x overbuild and 19h or battery storage do not suffice for that.
The raw materials required for a solar + battery system is another economic and environmental aspect I explore, at high level for now to bring across an important point: embodied energy is not only about the net-energy efficiency (eROI) but also about the net-raw material efficiency of our entire life around us… which we need to continuously improve on, not make it worse.
5.1 eROI of Al Dhafra
EROI compares the useful energy delivered by an energy system with the energy required to construct, operate, maintain and replace that system. The issue is that Al Dhafra does NOT deliver truly useful on demand 24/7/365 electricity. Therefore, this eROI calculation is useful but still underestimates what it takes to use solar (or wind) to replace a 1 GW coal, gas or nuclear power system with 20% reserve margin to deliver truly 24/7/365 electricity.
My simple calculation of the Al Dhafra solar + battery system, that is wrongly claimed to supply 1 GW of dispatchable power, estimates the eROI to be between 5 to 6.
For Germany this would translate to eROI ≈ 2 because the sun shines about 2.5x less in Germany than in the UAE.
In reality, several additional energy requirements and operational losses must be considered which are not fully captured by my calculation below, but I discuss in the Appendix.
The key assumption in my calculation are about the embedded energy for both solar installations and battery installations, which tend to be far underestimated in standard life cycle assessments based on ecoinvent (see Appendix).
- for a complete solar system, I assumed 4 MWh per 1 kW, and it is based on the discussion and shortcomings of standard LCAs (life cycle assessment) such as by IEA and NREL. Mariutti explains all reasons in [5 and 6], see also the Appendix
- for the battery system I assumed 450 GWh per 1 GWh of installed capacity as calculated and detailed in my blog – Pros and Cons of Utility-Scale Battery Storage
- For a discussion about net load factors, natural capacity factors, and utilizations, please refer to my detailed blog on Natural Capacity Factor vs. Utilization
- All other assumptions are detailed below in Table 1, if anyone wants to change the assumptions, please feel free to do so
Fyi, Prof Hall and Prieto also found a low eROI for solar in Spain. Specifically, in their 2013 book Spain’s Photovoltaic Revolution: The Energy Return on Investment, Pedro Prieto and Charles A. S. Hall estimated eROI ≈ 2 Their result was low because they correctly looked at a much broader system boundary than conventional PV LCAs—incorporating infrastructure and services beyond just manufacturing the solar photovoltaic systems.
Again, this article here is not a scientific study (which is to come), but a simple back of the envelope calculation with imperfect but realistic assumptions not considering the true system required to replace a conventional power system with solar + batteries (or + wind for that matter). As such, you can consider these numbers too positive for solar. For more details on the subject of solar and wind+batteries please refer to my blog here.
5.2 Raw materials of Al Dhafra
A modern utility-scale solar installation contains much more than silicon cells. It requires glass, aluminum, steel, copper, polymers, trackers, foundations, inverters, transformers, cables, substations and control equipment. Clearly, all these metals and materials required to build these “renewable” systems come from somewhere… they are first mined.
Table 1 explains that 30-35 million tons of raw materials would need to be extracted (excluding overburden) to manufacture a 20-year Al Dhafra system, assuming a 10-year lifetime for the batteries. These are complex raw materials that require a lot of logistics and infrastructure to upgrade, transport, and process, them into metals to be used for the manufacturing of solar and battery systems.
For comparison a 1 GW coal fired power station that runs on average at 70% net load factor for 20 years would consume a total of about 40-45 million tons of 6.000 kcal/kg nar standard coal. Coal that is extracted relatively simply with less overburden removal and far less industrial processing required. The raw materials to build such a power stations is a fraction of that to build a solar plus battery system.
Again, these are just indications to illustrate how “ungreen” so called “renewable” solar energy systems are when comparing their true life cycle and attempt to deliver an electricity product with a similar utility as a coal, gas, or nuclear power stations would. Remember, that in 2025 in Germany, solar power was already valued at only 50% of the average power generated in the country. Thus, for a true comparison, one would have to double all economic, raw material, and environmental costs.
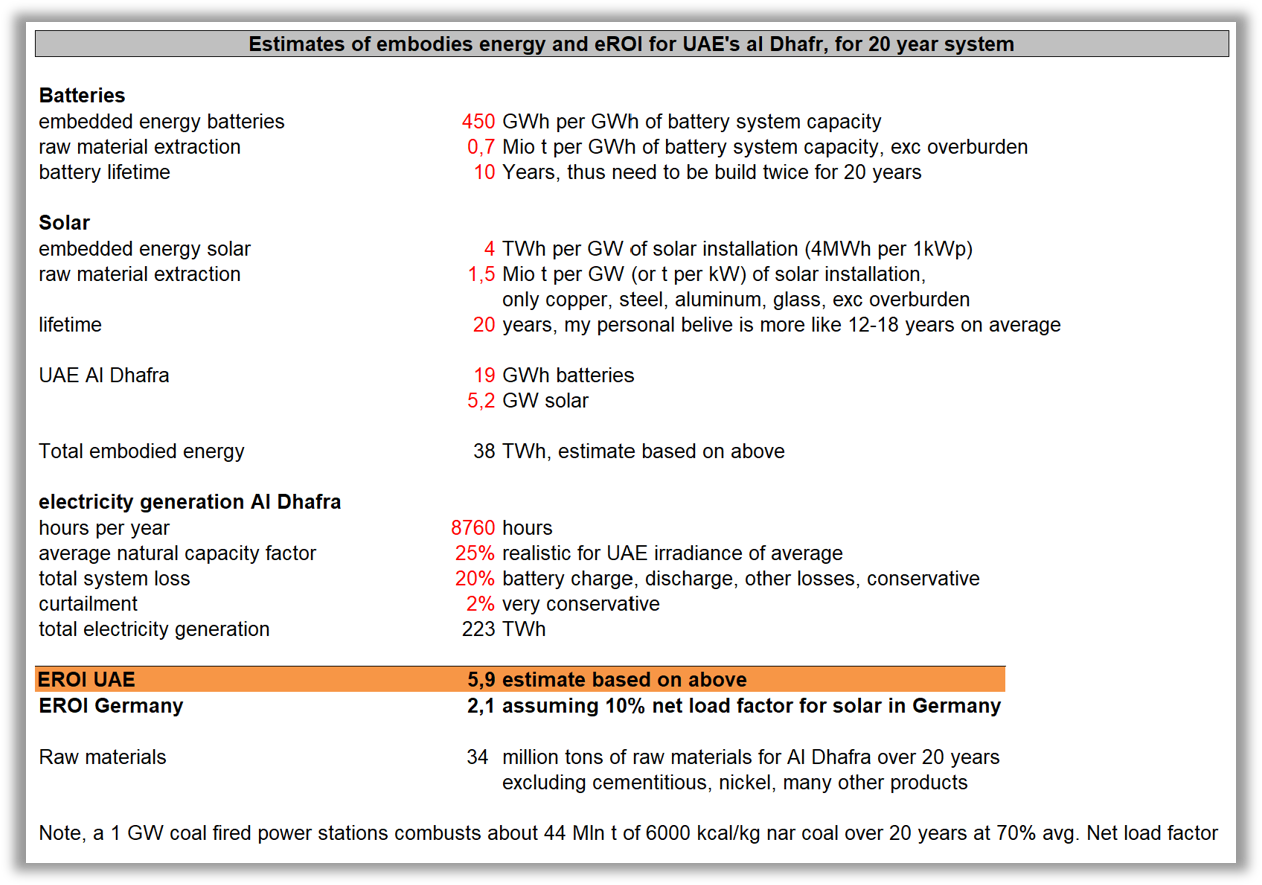
Table 1: Simple calculation of eROI Al Dhafra solar + battery system
Summary
Embodied energy is not an argument for or against any particular technology. Nor does it diminish the importance of operational efficiency or electricity generation, which remain essential metrics when evaluating energy systems. Quite the contrary, it guides us to “produce” the services we require as energy and raw material efficient as possible.
I am merely addressing the fact that every energy technology carries an often overlooked energy investment before it begins delivering useful electricity, and that the investment does not end once construction is complete. It continues throughout the life of the system as infrastructure is maintained, refurbished and ultimately disposed and replaced.
A comprehensive comparison of energy technologies should therefore extend beyond operational performance alone to include the total energy required to build, maintain and repeatedly renew the infrastructure on which electricity generation depends. Only then can confidently compare technologies on a genuinely like-for-like basis.
These implications extend well beyond electricity generation, filtering through to the materials required for modern energy systems, like steel, cement, copper, aluminium, silicon, lithium, nickel, glass, and rare earth elements, which must themselves be mined, processed, manufactured and transported using energy-intensive industrial processes. As energy systems based on wind and solar become increasingly infrastructure intensive driven by their low energy density, intermittency and short operational liftime, embodied energy becomes an increasingly important component of the overall energy balance.
The UAE Al Dhafra project is one of the world’s most favourable locations for solar generation, receiving more than 2.5 times more solar irradiation than Germany. If a system of this scale requires around 5.2 GW of solar panels, 19 GWh of battery storage and an illustrative system-level eROI ≈ 5-6 under these exceptional conditions and still it does not provide me the same security as a gas-fired power station. What would an equivalent system require in countries where the solar resource is only half, or even one-third, as strong?
The answer…much more of everything discussed and more infrastructure, leads to higher economic and environmental costs and more uncertainty.
In my calculation, the eROI for Al Dhafra if it were located in Germany would be 2-3 while providing much less value than the UAE installation as batteries would be charged less. In fact, one would need more overbuild in Germany than in the UAE likely reducing the eROI to below 1, thus becoming a net energy sink.
At this point I would like to ask you: Should success be measured solely by what happens during operation, or should it also reflect the total lifetime energy investment required to build, maintain and decommission, dispose, and replace the system itself?
The answer to that question may significantly influence how we evaluate future electricity systems, compare competing technologies and allocate limited fund and natural resources.
After all, every energy system has an energy bill.
Appendix
On eROI
Mariutti coal assumption for Chinese solar panels [3] “According to my estimates, in the worst case (100% coal energy supply), 1,200 kg of coal are needed to produce a 1 kWp photovoltaic system”, lets therefore just assume 50% or 600kg of that, which would mean
- Typical bituminous (~24–25 MJ/kg): 600 × 24.5 ≈ 14,700 MJ ≈ 4 MWh/kWp
- We assume this includes all heat and electrical energy used for all component manufacturing, for all
For comparison, the IEA [10] states about 1.2 MWh/kWp, back calculated from their statement of 1.2 years of “non-renewable energy payback” time with an annual “yield” of 975 kWh/kWp/year. I believe those numbers are off possibly in an order of magnitude as explained in [1, 2, 3] and my own work together with Mariuitti.
Additional energy requirements: In reality, several additional energy requirements and operational losses must be considered which are only partially captured by my calculation
a) Reduced solar generation
Solar output varies with atmospheric and operating conditions which in Abu Dhabi may include:
- dust and sandstorms
- atmospheric haze
- panel soiling
- high module temperatures
- seasonal variation
- cloud cover
- equipment outages and
- gradual module degradation
Any installation designed around expected weather conditions cannot guarantee that every period will match the assumptions used in the design model. Periods of unusually weak solar generation may reduce the amount of electricity available for supply and for battery charging.
b) Restricted battery operating range
A nominal 19 GWh battery does not necessarily provide 19 GWh of usable electricity. Batteries are generally not charged 100% nor discharged to 0%, because operating at these extremes accelerates degradation and shortens battery life.
c) Battery round-trip losses
Electricity used to charge a battery is not returned in full. Based on my calculations from my earlier blog, “Pros and Cons of Utility-Scale Battery Storage,” the full round-trip efficiency of utility-scale battery storage may be approximately 70–80%, depending on the operating conditions and system boundaries used.
This means that delivering 1 MWh from the battery may require approximately 1.25–1.43 MWh of charging electricity.
d) Auxiliary or parasitic consumption
All systems also consume electricity simply to remain operational. In a hot climate, battery cooling may be especially significant because elevated temperatures accelerate degradation and reduce performance.
This electricity is consumed inside the project and must be deducted before calculating the net electricity delivered to customers.
e) Equipment availability and maintenance
No large industrial system operates without interruption and planned down-time for maintenance and repairs with occasional unplanned outages should not be ignored. Even a highly reliable system will experience periods during which parts of the installation are unavailable.
f) Battery degradation and augmentation
Batteries do not maintain its original usable capacity until the day on which it is replaced. Battery augmentation may therefore be required throughout the operating life. Additional modules may have to be installed before the main replacement simply to maintain the promised output and storage duration.
The embodied energy associated with this augmentation is not included in the theoretical calculation.
g) Curtailment and unused surplus electricity
The solar installation in question has a capacity of 5.2 GW, while the claimed continuous output is only 1 GW.
During favorable daylight conditions, solar generation may exceed both the 1 GW export requirement and the battery’s available charging capacity. Once the battery is sufficiently charged, some additional solar generation may have to be curtailed.
The panels, trackers, inverters and other infrastructure required to produce this surplus still carry embodied energy, even when the electricity cannot be used.
This is one of the fundamental penalties of overbuilding variable generation: The system must be large enough to cope with difficult periods, while part of its potential output may remain unused during favorable periods.
h) Grid-support requirements
We have seen that continuous electricity supply requires more than energy alone and a reliable electricity system must also manage:
- voltage
- frequency
- reactive power
- phase
- fault ride-through
- short-circuit strength
- system inertia or synthetic inertia
- black-start capability and
- contingency reserves
Providing these services may require:
- additional inverters
- synchronous condensers
- transformers
- control systems
- reserved battery capacity
- conventional power plants as backup, and
- additional transmission infrastructure
Some of this equipment consumes electricity directly. Some carries additional embodied energy. Some reduces the amount of battery capacity available for ordinary electricity delivery, but they all influence our calculation in one way or another. These requirements are often excluded when the performance of solar panels or batteries is discussed in isolation.
Links and Resources
[1] Gutowski et al 2013 – The Energy Required to Produce Materials: Constraints on Energy-Intensity Improvements, Parameters of Demand.” Philosophical Transactions of the Royal Society A: Mathematical, Physical and Engineering Sciences 371, no. 1986 (2013): 20120003 (link)
[2] Allwood, Julian, and Jonathan Cullen. UIT Cambridge Ltd. – Sustainable Materials without the Hot Air. 2015. (link)
[3] Ashby, Michael F. Materials and the Environment: Eco-Informed Material Choice. Butterworth-Heinemann, 2009.
[4] Hall et all 1988: Energy and Resource Quality: The Ecology of the Economic Process. Vol. 64. 1988 (link)
[5] Mariutti, Enrico. “Mariutti: The Limits of the Current Consensus Regarding the Carbon Footprint of Photovoltaic Modules Manufactured in China: A Review and Case Study.” Energies 18, no. 5 (2025): 5. (link)
[6] Mariutti, Enrico. The dirty secret of solar industry – Enrico Mariutti. April 2023. (link)
[7] IRENA: 24/7 Renewables: The Economics of Firm Solar and Wind. IRENA, 2026. (link)
[8] Mariutti, Enrico. “The Real Carbon Intensity of Photovoltaic Energy.” Substack newsletter. Enrico Mariutti, August 17, 2023. (link)
[9] Masdar Reaches Financial Close for World-First US$6.1 Billion Gigascale 24/7 Clean Energy Project.” July 2026. (link)
[10] Frischknecht et al 2015, IEA: Life Cycle Inventories and Life Cycle Assessments of Photovoltaic Systems. NREL/TP-6A20-73853, 1561526. 2015. (link)
[11] Lambert et al 2014: Energy, EROI and Quality of Life.” Energy Policy 64 (January 2014): 153–67. (link)