
My first moped when I was fourteen, back in East Berlin, had no starter battery. The only way to get it running was to kickstart it which, back then, seemed perfectly normal. Batteries were expensive and heavy.
My current modern motorcycle (apologies to the Harley owners, because as a German I ride a BMW 😉) has a battery powerful enough to drive it in reverse and operate a complex control and entertainment system.
Batteries have evolved, they have become better, more efficient, safer, and lasting longer, and today entire cars run on batteries for hundreds of kilometers. But it doesn’t stop there.
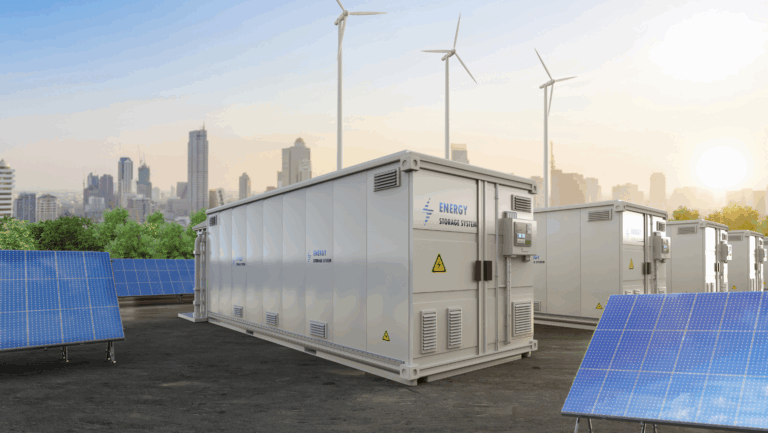
The expansion of grid-scale (or utility-scale) batteries for providing grid storage especially for solar is one of the “hottest” topics of the “energy transition” these days. For instance, many provinces in China still have the mandatory requirement that solar projects are to include battery storage. There is no doubt that utility-scale batteries have many benefits, but let’s honestly consider what batteries do to our environment and to the net energy efficiency.
It is therefore high time that we explore the capabilities and short-comings of grid-scale batteries, the production thereof and the impact they have on our energy systems.
Please note, that although the principal concepts are similar if not the same, the focus of this article is on utility-scale batteries and less so on home battery systems nor on electric vehicle batteries (EVs).
In the recent past, batteries were mostly useful for starting engines and powering our home gadgets. To-date, the energy sector already accounts for over 90% of annual lithium-ion battery demand, where 10 years ago, when the market was 10x smaller, it was a mere 50%.
The topic of large battery systems is a complex one, which I, and many others, could write a book or two about. In my blog today, let me summarize some of, what I believe to be the key points in this regard.
Buckle up as the batteries of your phones or computers keep your screens bright and readable.
Ps: I will have a more detailed discussion in the Appendix, in order to make the article more readable and shorter. Sources and abbreviations used, as usually, are given under “Links and Resources”
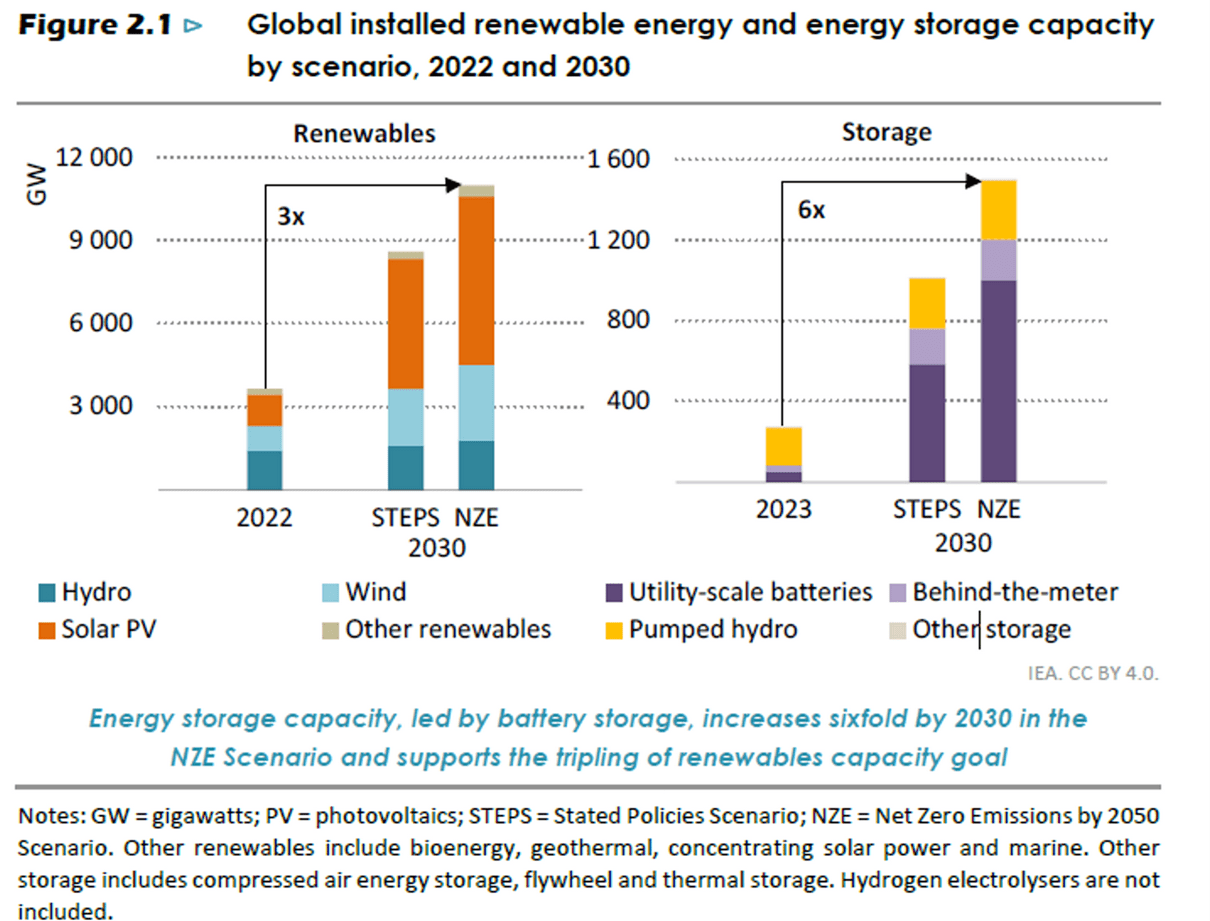
Figure 1: Installed energy storage capacity requirement by 2030
Note: Energy storage should be rated in GWh, not GW, since they do not provide continuous load, only for the time until the storage is empty | Source: IEA [1], p68
“Electricity is difficult to store”…. A true statement, but IT IS POSSIBLE to store electricity as all of us can confirm with our phones and laptops on a daily basis. Technology can do wonders and with sufficient money, energy, raw materials, human ingenuity, and land space we can literally reach for the stars.
However, let me illustrate to you how difficult it is to store energy in the form of electricity. Despite the recent drop in power storage costs, storing electricity remains 100-1000x more expensive than storing energy in the form of coal, oil, or gas [2]. Transporting electricity is “only” about 10-50x more expensive than transporting energy in the form of coal, oil, or gas (Desantis 2021, [3]). I feel this worth exploring, so let’s dive deeper into it!
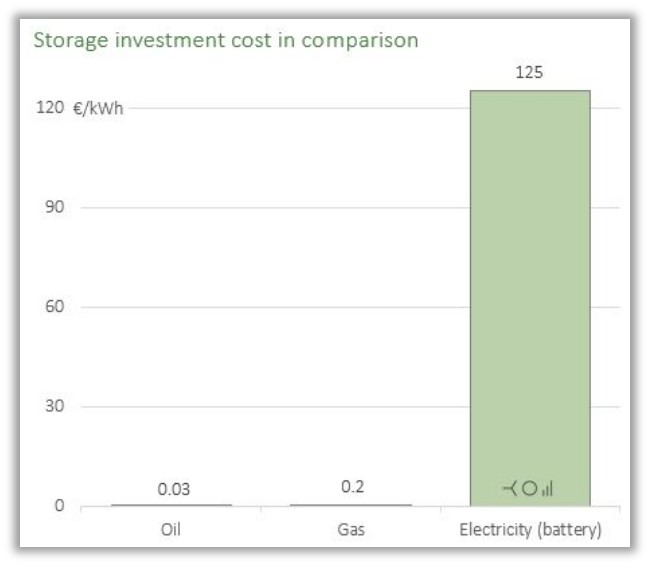
Figure 2: Storage investment cost in comparison | Source: Prof Lion Hirth 2025, Hertie School, Germany [2]
Key Point 1: Most utility-scale batteries are ONLY required because of the ever-increasing installed capacity of intermittent, weather dependent wind and solar power, which are largely useless without extensive and complex network integration, backup, and storage systems.
Upfront an important note on power (MW) and energy (MWh) [4]: Electricity systems are often quoted in terms of their power – the amount of energy delivered per second, measured in MW or kW.
However, a 400 MW gas-fired power station is very different to a 400 MW battery energy storage system (short BESS). So long as there is fuel available, the gas turbine can deliver 400 MW almost continuously, apart from occasional downtime to allow for maintenance. This is not the case for a BESS, which can only deliver its rated power (MW) for a short time, because the total amount of energy (MWh) it can supply is severely limited.
Therefore, battery capacity measured in MWh is more relevant (Figure 3). A typical 400 MW BESS is assumed to operate for 4 hours before exhaustion, so its capacity would be 1600 MWh.
Another note: all abbreviations are at the end of the document under Links and Resources
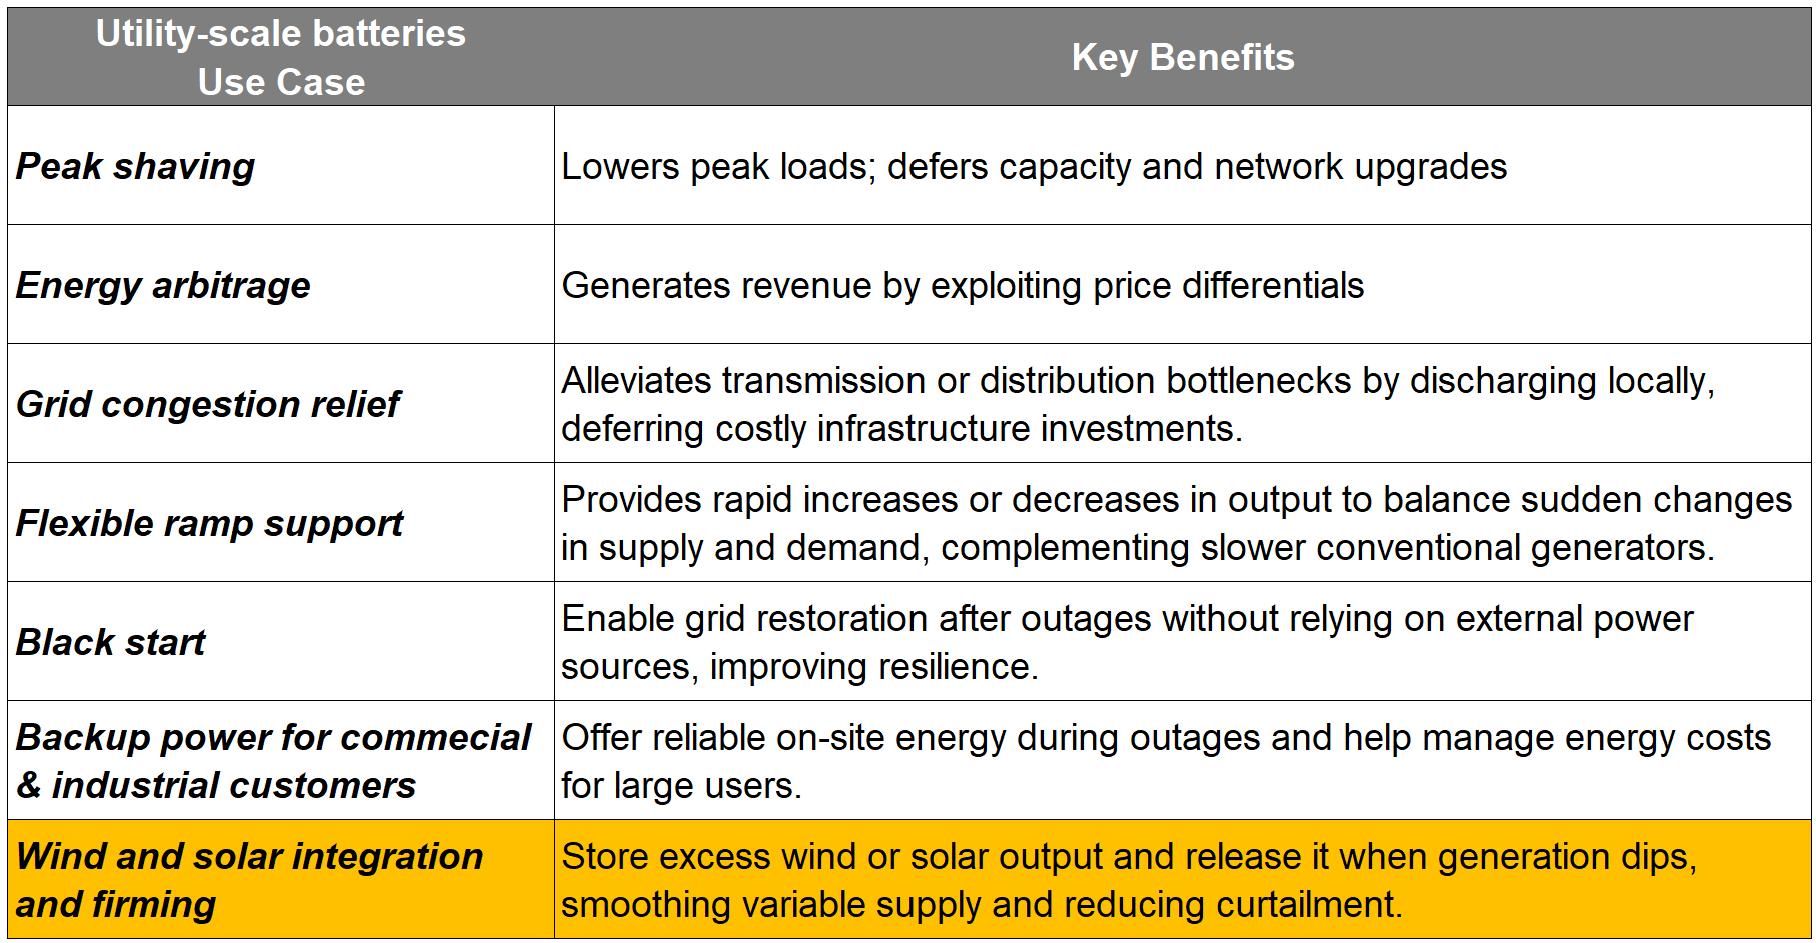
Table 1: Use cases for utility-scale battery systems | Source: Schernikau research and analysis
Key Point 2: Utility-scale batteries are ONLY short duration energy storage systems, which provide backup storage for a few hours at best, not for days or weeks. Thus, “solar + battery” does NOT provide dispatchable 24/7/365 power.
Key Point 3: Utility-scale batteries deteriorate at a rate of 3-7 % p.a. and batteries should neither be fully discharged nor charged to 100%, as this degrades their lifespan. In practice, the recommended range is 20% to 80%, meaning only around 60% of the nameplate capacity is actually usable on a daily basis.
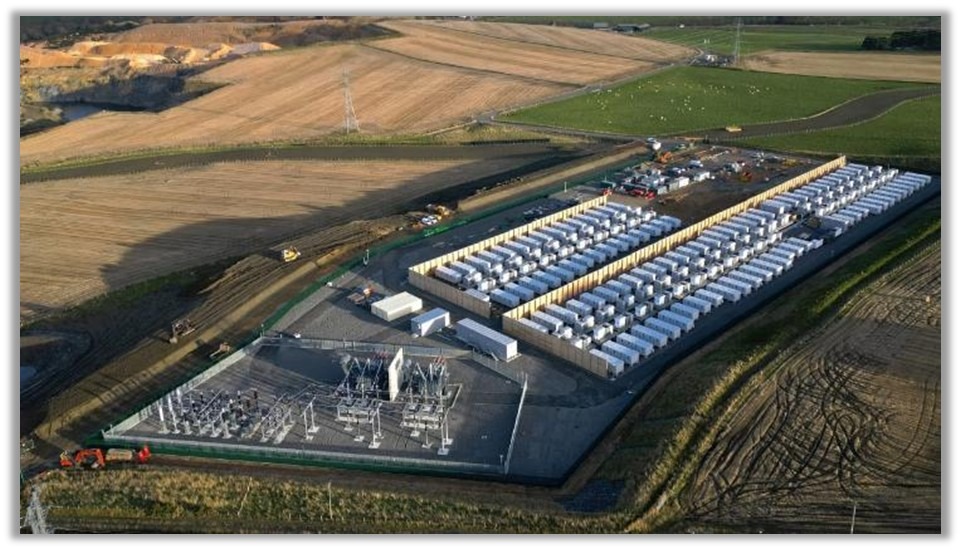
Utility-scale batteries are taking off, selling like hotcakes, from California, Germany, China, Chile all the way to Australia and South Africa. Worldwide, almost all energy policy makers and utilities are planning to install large amounts of utility-scale batteries in the aim to provide grid-services to the power grid.
Definition: Utility-battery storage is an energy storage system with a capacity of a few MWh and upwards, typically collocated with transmission or distribution grid assets or large commercial/industrial loads to enhance grid flexibility and wind and solar integration.
Historically, large-scale storage was dominated by pumped hydro. “Modern” utility-scale storage is increasingly based on lithium-ion chemistries.
Statistics (summarized from various source, no guarantees)
- One Gigafactory produces about 50 GWh of all types of batteries a year
- About 1 TWh capacity, in the form of batteries, were added in 2024 (90% of global annual battery sales came from electrified and hybrid vehicles)
- By the end of 2024, the total installed battery capacity is around 3TWh, 4-5 times higher than in 2020… mostly installed in 40 mil EVs
- For comparison, Germany consumed about 460 TWh of electricity in 2024 (1.6% of global electricity consumption)
While this article focuses primarily on batteries for short-duration storage of wind and solar, it is important to realize that batteries fulfil various, invaluable functions within the grid. (Table 1). The non-storage functions, however, do not require the large battery capacities currently envisioned as in Figure 3.

Figure 3: Predicted battery energy storage growth until 2035 | Source: BloombergNEF [5]
2. Lifetime, efficiency, and battery chemistry/technology
As batteries become cheaper, weight and longevity are often sacrificed in order to optimize production costs. The lifetime estimate stated here, may appear to be underestimated, but real life rarely follows desk-based-research results.
85% roundtrip efficiency was mentioned by NREL 2024 [4] based on Cole and Karmakar 2023 and by many other institutions. However, the commonly cited 85% round-trip efficiency (RTE) figure for utility-scale batteries is idealized, reflecting DC-to-DC cell-level efficiency under lab conditions, not system-level performance in real-world grid deployments. When including conversion losses, thermal management (i.e. cooling), power for controlling, communication, lighting, ventilation, as well as transformer losses and wiring the reality of grid-scale battery round-trip efficiency (RTE) is closer to 70%. Either way, in this simple analysis here, I did not adjust for this.
Lithium-ion (LFP and NMC) manufacturer warranties often cite 10-15 years or 3000-6000 cycles.
- Real-world data (e.g., PG&E, Tesla Megapack, Fluence systems) show calendar life closer to 10-13 years, with accelerated aging in hot or poorly managed installations.
- High-DoD (Depth of Discharge) cycling, as is typical in “renewables” shifting, reduces usable life significantly.
- NMC batteries show even faster degradation due to higher internal resistance growth and greater sensitivity to heat and high-current cycling.
- Some systems require partial mid-life module replacement after 5–7 years, a growing trend for Li-ion BESS in hot regions.
Energy density (energy per unit of weight) is a very important subject when it comes to EV batteries, but it is less critical for stationary utility-scale battery storage, leading to a significant shift towards LFP – Lithium Iron Phosphate for BESS. See section 5 for more information on energy density.
Other battery technologies: Sodium-ion is still too new for validated degradation models. Lab tests show promise, but until multi-year utility-scale datasets are public and estimates remain speculative. In Japan and the Middle East, Sodium-Sulfur (NaS) has shown a 15-20 year lifespan, under highly specialized, controlled operations. Flow batteries live up to their cycling claims, but the electrical and pumping systems may need overhauling after 10-15 years, thus operation and maintenance costs are often underestimated.
Avoiding discussing battery chemistry in detail here, let it suffice to say that lithium-ion batteries still dominate both EV and utility-scale storage applications. Chemistry can be adapted to mineral availability and price, demonstrated by the market share for lithium iron phosphate (LFP) batteries rising to 40% of EV sales and to 80+% of new utility-scale or standard battery storage [6]. The table in Figure 4 summarizes different battery technologies highlighting what is mostly used for utility-scale batteries: LFP and NMC Lithium-ion battery systems. For fun and for comparison, I added coal.
Fyi, Nickel-iron batteries, also known as NiFe batteries or Edison batteries, are a rugged, long-lasting rechargeable battery technology invented by Thomas Edison in 1901 recently being mentioned more favorably.
Key Point 4: Utility-scale batteries are expected to last on average 10-13 years. Real life round-trip efficiency (RTE) of utility-scale solar is around 70-80% realistically.
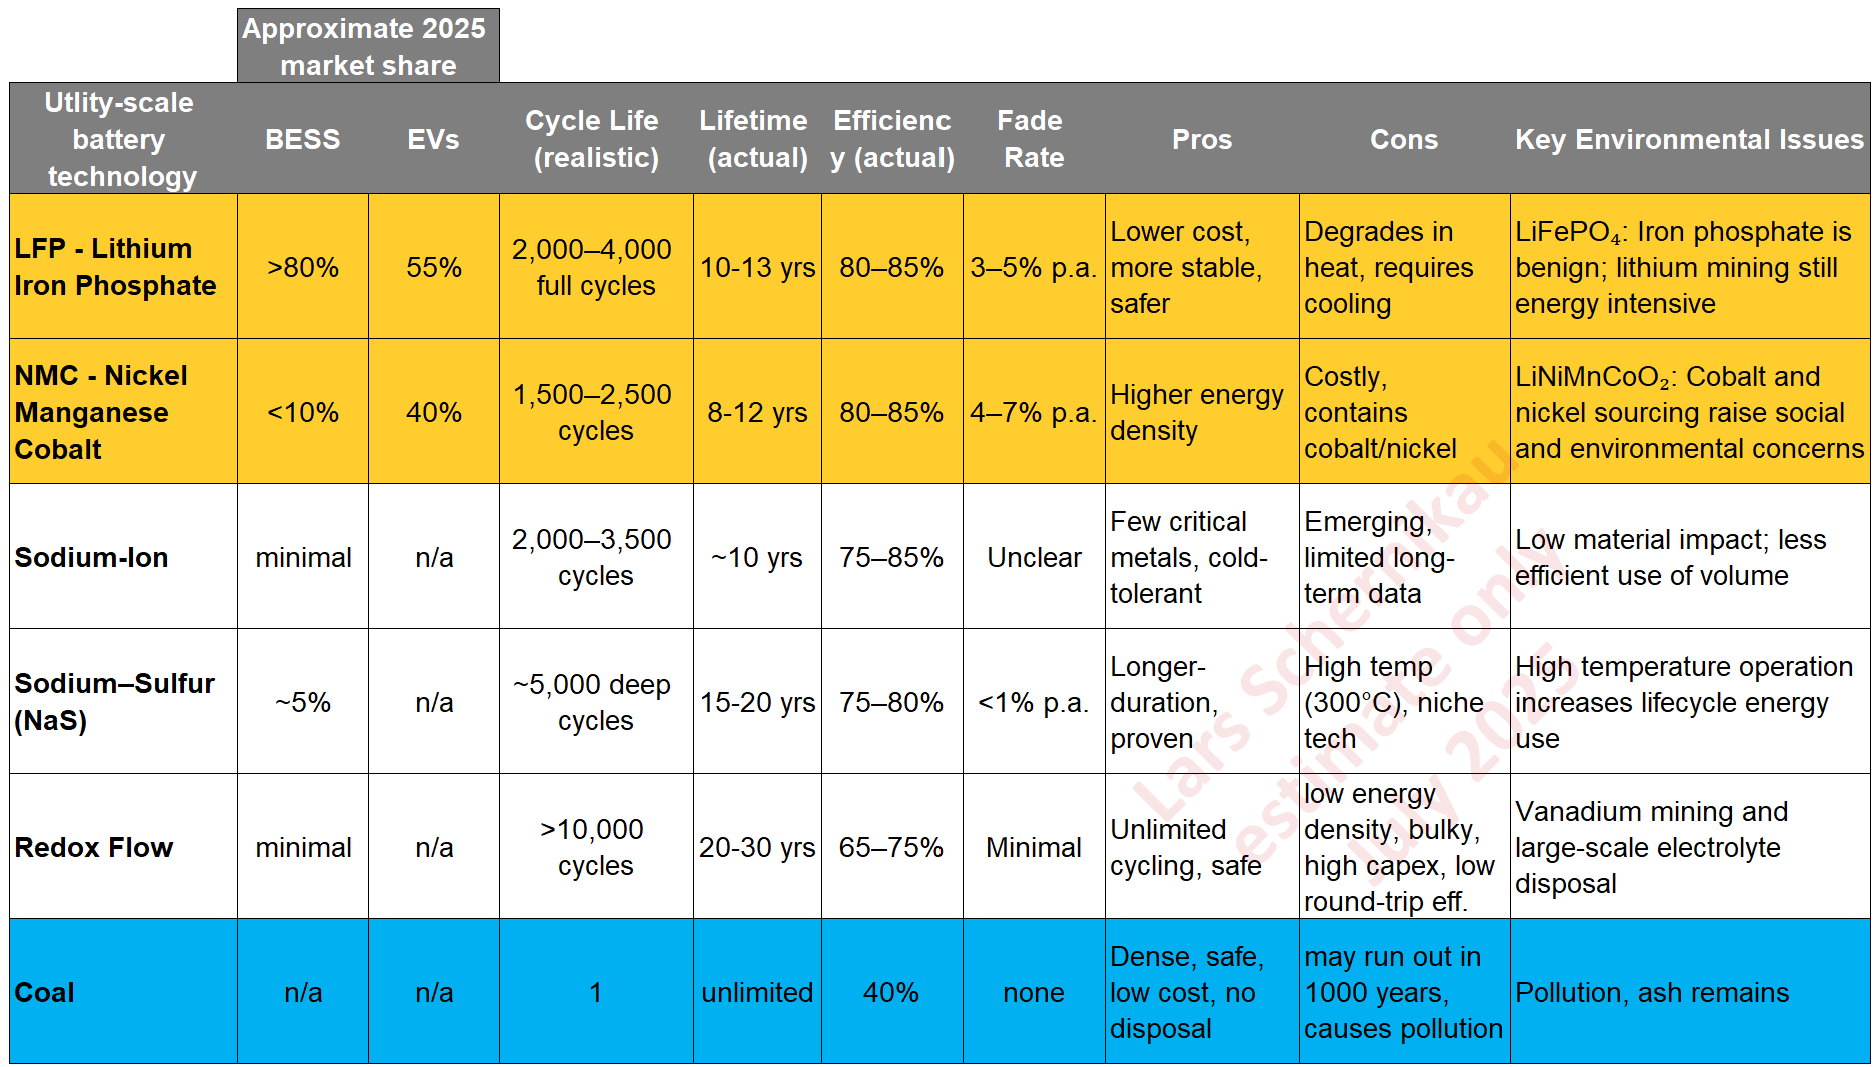
Tabel 2: Li-Ion leads the way, comparison of key battery technologies | Source: Schernikau based on research and analysis
3. Battery costs
In 2024, the global battery-pack market (EV and stationary BESS) reached roughly USD 140 billion, expected to rise to about USD 800 billion by 2030 under the IEA’s Net-Zero Emissions by 2050 scenario [6]. In 2024, only about 10–15% of battery-pack spending was on grid-scale storage, with the vast bulk gone to EV batteries.
Those of you that read our book “The Unpopular Truth… about Electricity and the Future of Energy” will remember that price does not equal cost. And the price of utility-scale batteries has dropped to unimaginable low numbers. While costs also reduce, they are not in line with the latest prices quotes.
- A recent auction in China for a 25 GWh LFP BESS project reached levels of almost 50 USD/kWh (bidders included CATL, BYD, Envision, Sungrow and over 60 others).
- This represents a 30% drop from 2024 levels [7]. There is no way, not even in China, that one can produce utility-scale batteries at such a low cost. The sellers are losing money and I guess they are hoping for a “cost-miracle” by the time they have to deliver on their contracts!
- Note: remember that usually only 80-20 discharge cycles are allowed, so prices are actually 40% higher per usable kWh. Also wind and solar needs to be overbuilt to allow for energy losses from storage, which is not included in the cost either.
At the low extreme, Chinese developers (and various subsidy-backed projects) are offering <100 USD/kWh for turnkey battery systems, but I doubt this is the total system cost. Higher-cost markets and earlier projects might still be at 300-400 USD/kWh (Figure 4, [2]). Most new utility-scale projects in the U.S. are now coming in around 200-300 USD/kWh installed, before IRA incentives, a substantial improvement from just a couple of years ago.
Continued technological improvements and scaling are expected to drive costs even lower: industry forecasts (NREL, BNEF, RMI, etc.) envision sub-100 USD/kWh installed costs by the end of this decade in relation to standard lithium-ion storage. However, costs may stabilize or even increase, if raw material prices rebound or if an overwhelming surge in demand strains the supply chain again. Project developers are also mindful of integration and operational factors beyond capital cost.
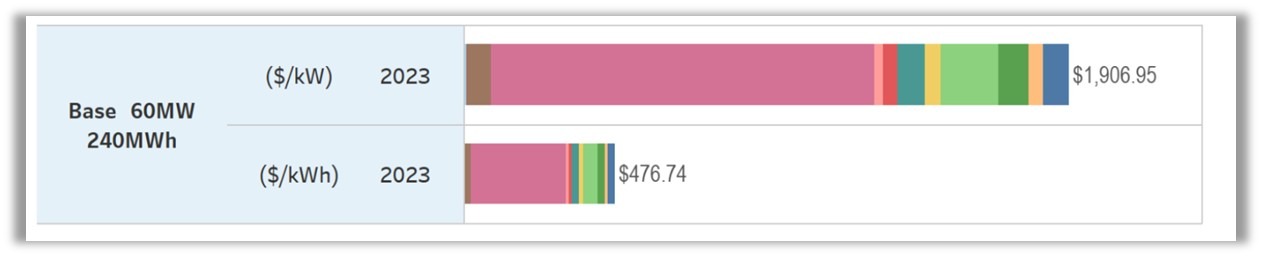
Figure 4: Cost details for utility-scale storage (4h 240MWh usable) | Source: NREL 2024 [6] Impact on the grid
Key Point 5: In real life a 4-hour Lithium-Ion LFP utility-scale battery system’s fully installed costs, not necessarily price quoted, in 2024 to 2025 range between 150-250 USD/kWh
Case in point: The Moss Landing Energy Storage Facility in California is currently the largest lithium-ion battery storage system in the world. It was completed in Jun 2023, holds probably 932 MW or about 3.73 GWh and costs in total an estimated USD 1.2 billion. That translates to a total cost of 320 USD/kWh.
The process of building utility-scale systems involves multiple steps, each adding complexity and cost, often more than expected.
- Metals and materials supply: Mining, upgrading, transporting, processing, refining raw materials. That includes converting concentrates into high-purity metals.
- Component manufacturing: Electrode foil, separator, electrolyte, cell housing, etc.
- Cell production: Coating, drying, calendaring, stacking/winding, electrolyte filling, formation cycling
- Module and pack assembly: Cells are integrated into modules/packs, including BMS and cooling
- BESS assembly: Final integration includes thermal management, power conversion, enclosures, controls
Key Point 6: Raw material or commodity prices, excluding gold, are at historically low levels in comparison to equities… something will have to give, my take is that commodity prices will rise impacting long-term battery costs.
4. Raw materials and embedded energy
Key Point 7: 1 GWh of utility scale lithium-ion batteries requires ~0,7 million tons of raw materials (ores) to be mined, upgraded, transported, processed, and manufactured into utility scale batteries. More details in the appendix.
China controls ~90% of battery cell component manufacturing (anodes, cathodes), ~80+% of battery cell manufacturing, and majority of raw material processing for batteries.
I love commodities and energy, so the question of what it takes to build utility-scale batteries had been on my mind for a long time. In writing this article I finally took the time to research and spend some more time on a subject that I have not seen widely written about before.
Thus, the ~1 TWh batteries required in 2030 alone shown in Figure 3 estimated by BloombergNEF, if it were all BESS, would mean that we will need 700 million tons of additional raw materials for the production of those batteries just in one year.
Keep in mind that world mines or extracts about 80 billion tons of raw materials from Earth, so this would be about 1% of annual extraction for only batteries [7a]
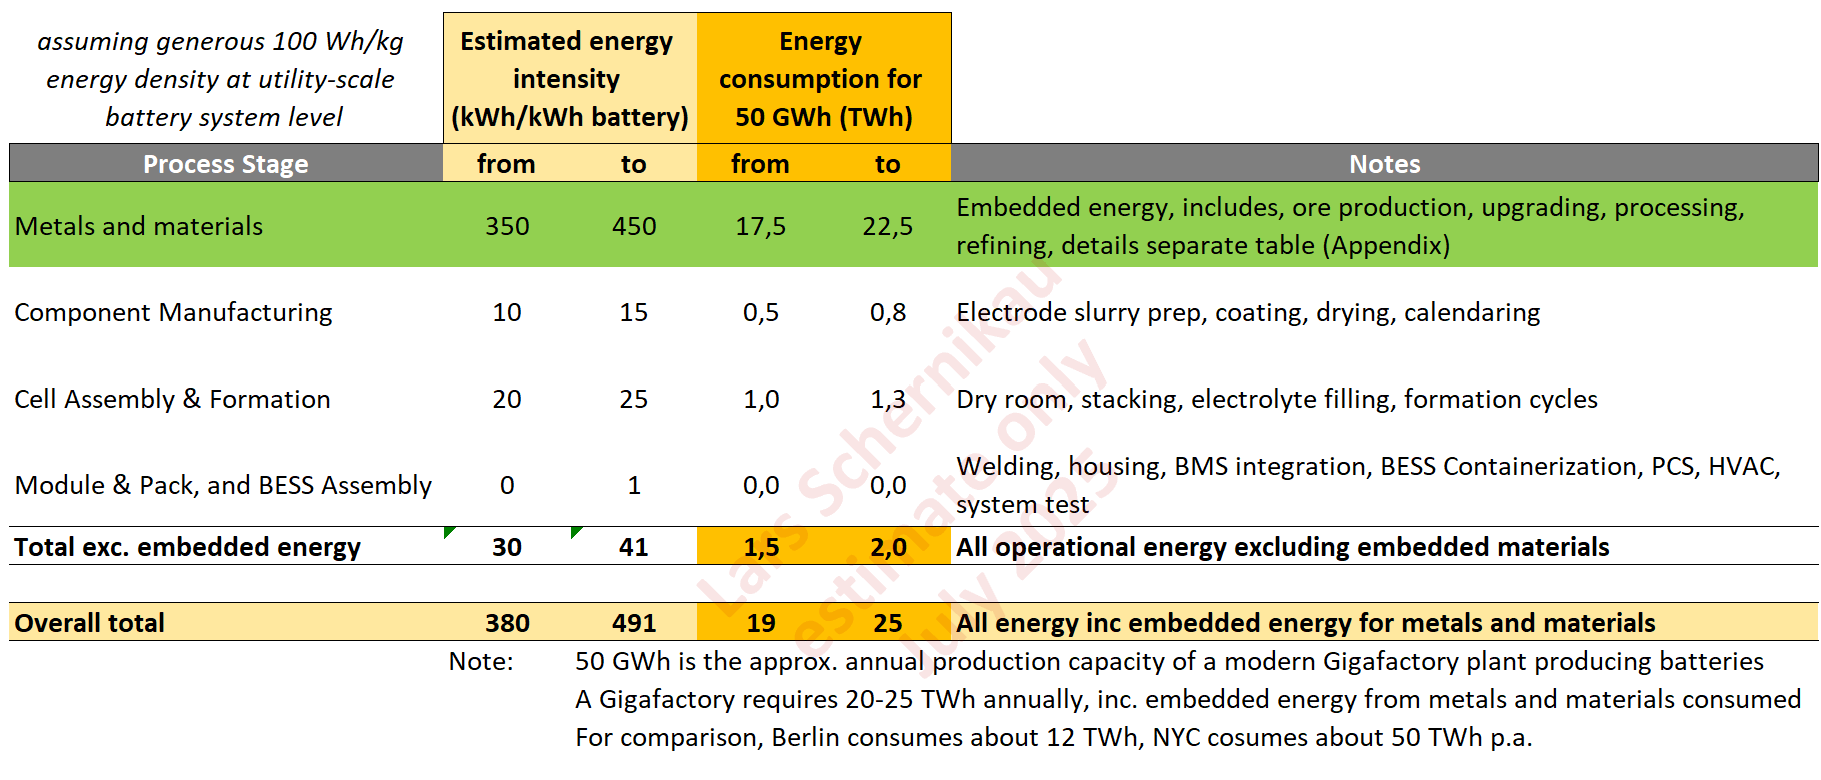
Table 3: Estimated total energy use for lithium-ion utility-scale battery manufacturing | Source: Schernikau based on [9 and 10]
The ~1 TWh batteries planned for the year 2030 would then require ~450 TWh of energy equaling Germany’s entire 2024 electricity consumption.
To illustrate, let us calculate what it would take to have sufficient battery backup for 1 single day for Germany during a reasonably normal winter day when in the future no coal, gas, or nuclear may be available. 60 GW x 24h = 1,4 TWh of utility-scale batteries which would require ~1 billion tons of mining, upgrading, processing, transportation, manufacturing and ~630 TWh of input energy for construction of batteries first… and this every 10 years if the batteries last 10 years… and all of this is for just one day of storage!
A reminder, these batteries still have to be charged, and the charging infrastructure (here envisioned wind and solar with a complex network integration and transmission infrastructure) also needs to be built with raw materials and input energy first and replaced every few years. See also Prof Simon’s Michaux recent peer-reviewed detailed analysis on this [8].
Needless to say, nearly all relevant battery material processing, as well as cell and component manufacturing, is dominated by China. (Figure 8). Graphite mining, a very important resource also for battery cells, is also concentrated in China.
Key Point 8: 1 GWh of utility scale lithium-ion batteries requires approx. 450 GWh of energy (Table 3) before the battery can be charged for the first time… remember this multiplier of 450x.
A standard Gigafactory, with an annual battery production capacity of about 50 GWh, would require over ~20 TWh of energy annually, including the embedded energy of the metals and materials consumed p.a. This compares to the city of Berlin in Germany consuming 12 TWh electricity annually.
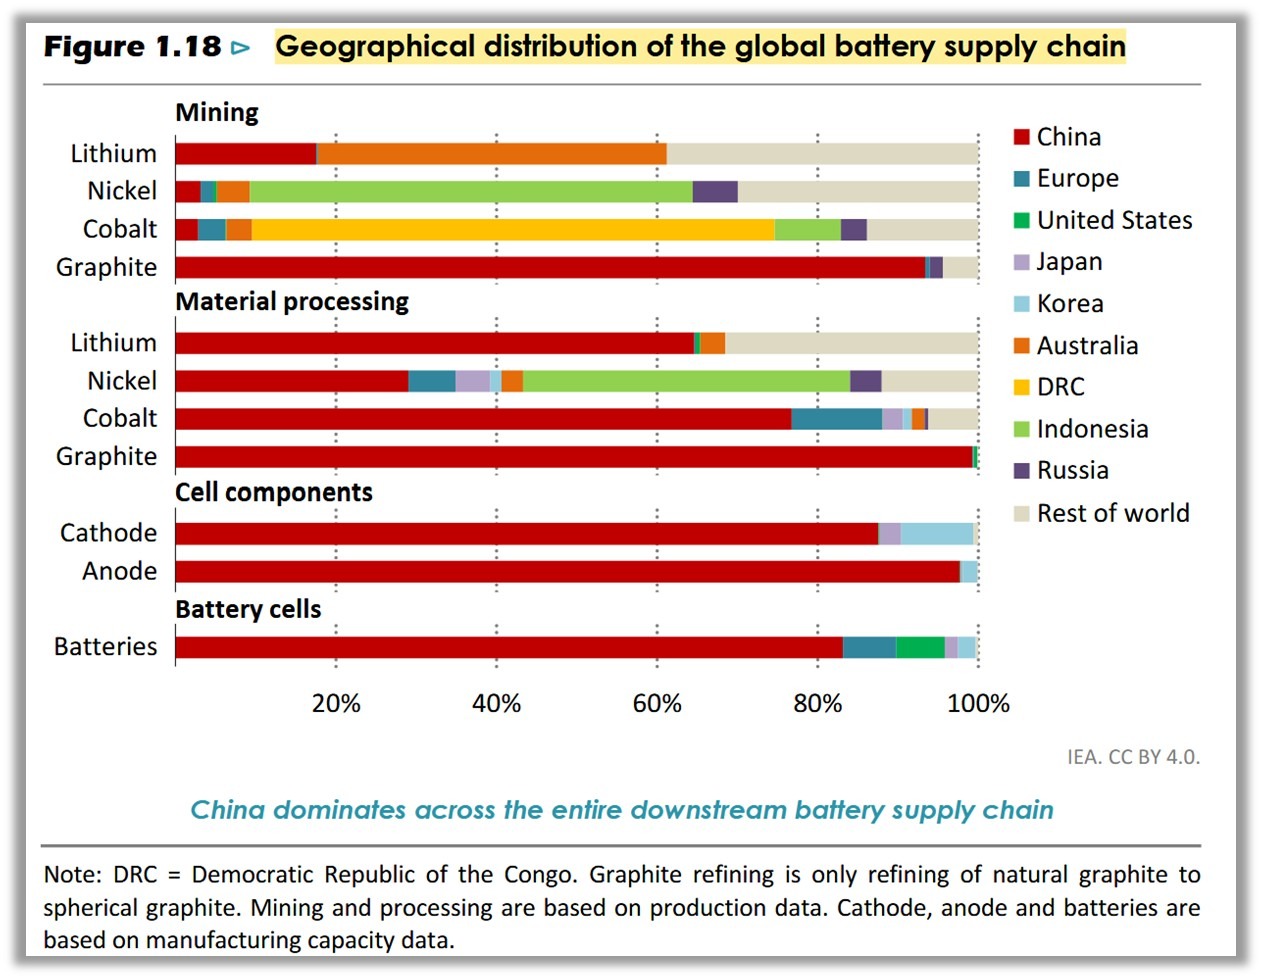
Figure 5: Geographical distribution of global battery supply chain | Source: IEA 2024 [1], p58
5. Energy density
Energy Density (energy or Wh per unit of weight or kg) is an all-important topic when it comes to understanding batteries. What is confusing is the fact that everyone speaks of energy density at the cell-level, but not at the battery system level. We estimate that the battery cell only makes up about 25% of the weight of a grid-scale battery. After scrutinizing real life data and often cited assumptions one quickly realizes that the often quoted 35-40% battery-cell-weight of total BESS weight is not correct.
The total BESS weight, in real life, is distributed roughly as follows. Keep in mind that the numbers are adjusted so it adds up to 100, I am not claiming exactness.:
- ~25% battery cells: refined pure metals, chemicals, acids for the entire system
- ~10% module and rack: Steel/aluminum frames, inter-rack busbars
- ~11% thermal management: Coolant, cold plates, pumps, heat exchangers
- ~27% power conversion: Inverter(s), transformer, switching gear
- ~16% container and balance-of-plant or BOP: Steel container, HVAC, fire suppression, cabling
- ~11% BMS, wiring, and other insulation and sensors: PCBs, sensors, harnesses, communication modules, safety systems, mounting hardware, insulation panels
Thus, a typical utility-scale battery system, probably allocates ~25 % of mass to battery cells vs ~60 to 75 % in an EV pack. Utility-scale batteries simply don’t need to be optimized for weight like an EV pack does. That is why my analysis above would look slightly different for EV batteries. Obviously, all of this is important because of the much-discussed energy density!
The IEA [1] writes that while lead-acid batteries have energy densities ranging between 35 to 40 Wh/kg, lithium-ion batteries currently have a demonstrated range of specific energies around 90-300 Wh/kg at the cell level. With their higher energy density, lithium-ion batteries can be stacked into lighter and more compact battery packs.
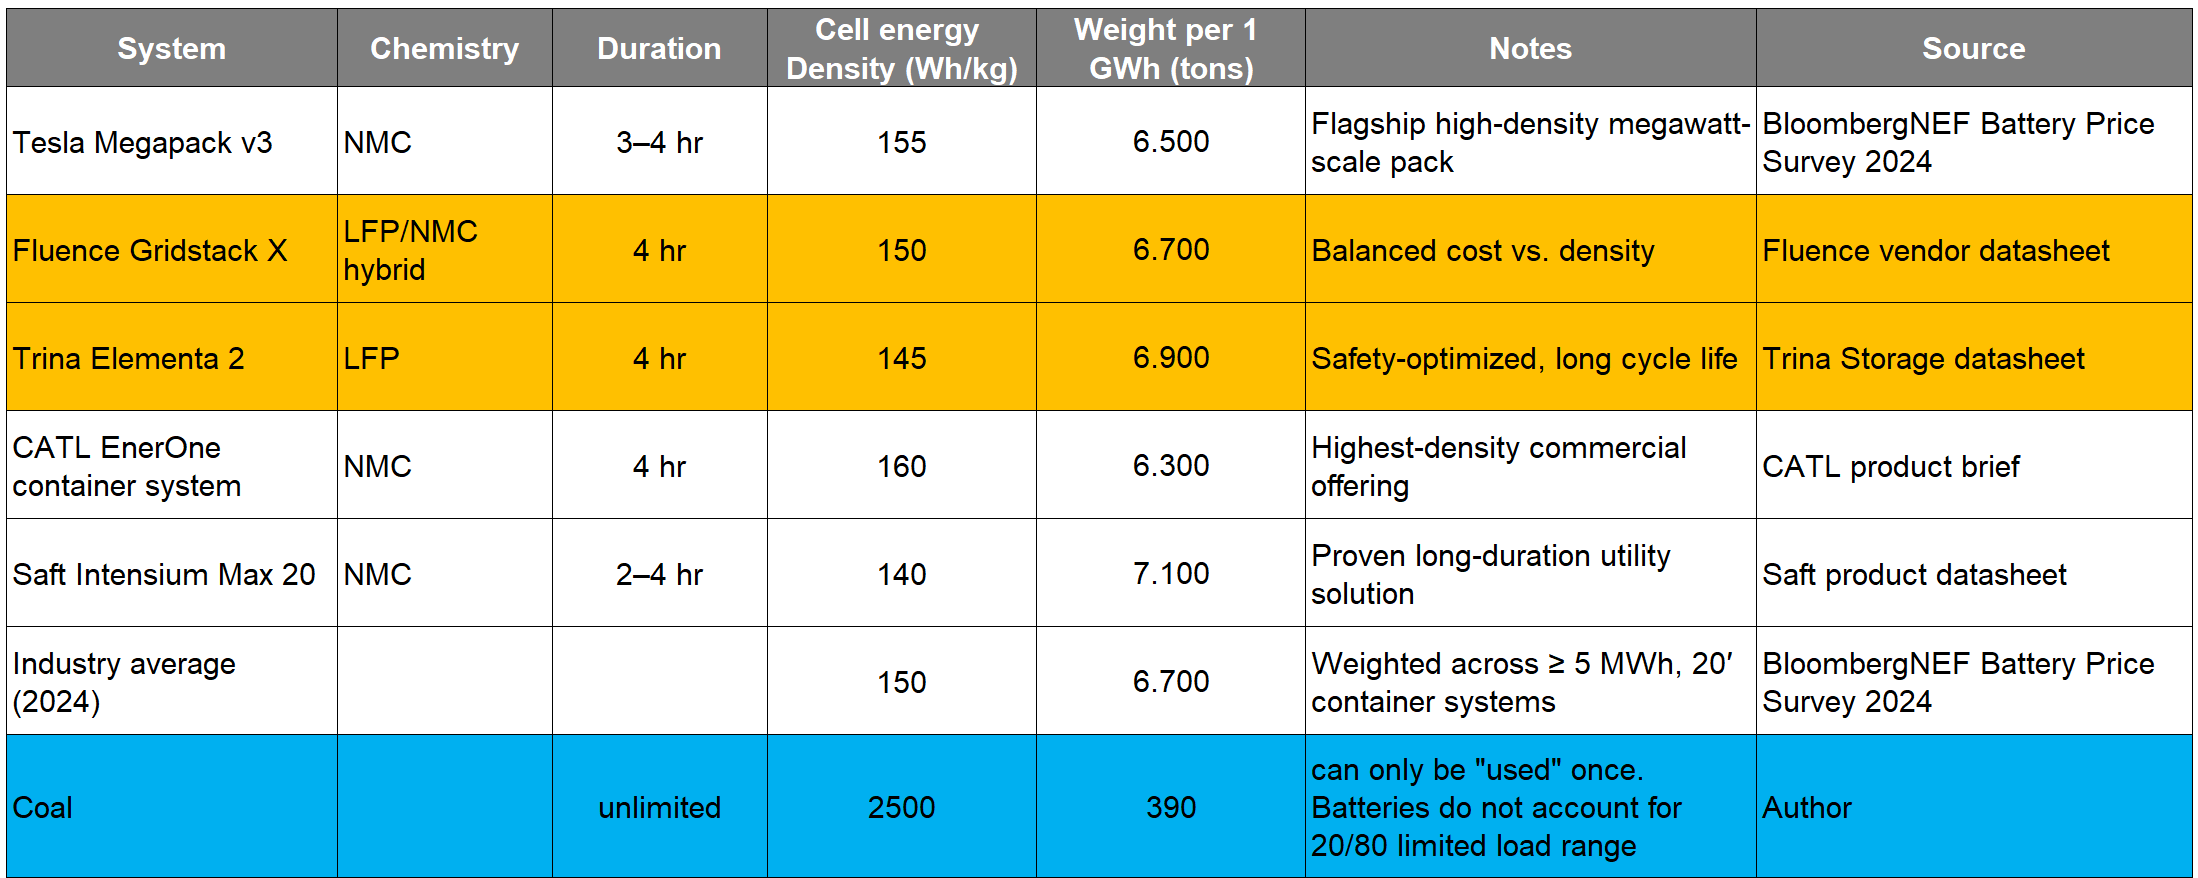
Table 4: 2024 Utility-Scale BESS Pack-Level Energy Density at Cell Level (Including Casing, Thermal & Balance of System, BOS)
A 1-ton utility-scale battery would then be able to store about 100 kWh but still needs to be charged. The 1-ton battery, when charged, contains the same amount of energy as 40kg of coal, already accounting for 40% power plant efficiency. This assumes standard coal at 5,500 kcal/kg, a reminder of just how energy-dense ‘fossil’ fuels are. No modern technology comes close.
For comparison, Table 4 includes some more energy densities of the most modern and newest utility-scale batteries only at cell-level + module and rack + thermal management. You can divide these numbers by 2-3 (the cell makes up 25% of the weight, module and rack about 10%, and thermals about 11%) to calculate the system-level energy density. For comparison, the most modern EV battery systems’ energy density reaches about 160-170 Wh/kg.
Key Point 9: 100 Wh/kg energy density for utility-scale batteries at system level (not cell-level) is very generous. I use this 100 Wh/kg here. Today’s reality lies more around 50 Wh/kg, which is confirmed by various data points. Reality would then double the tonnage and energy estimates mentioned here and in the Appendix.
6. Environmental and security risks
A large capacity grid-scale battery needs to be handled carefully…so much energy in a confined space is, in effect, an undetonated bomb. A recent working paper by Fordham et al. [11] – a group of eminent physicists – observed that a fully charged 1 MWh BESS has an explosive potential equivalent to 0.86 metric tons of TNT.
Marlair et al. [12] concludes that ‘No lithium chemistry, not even less reactive LFP lithium-Ion chemistry, is exempt from thermal runaway’. Lithium battery cells, under certain circumstances, can overheat. If they reach a certain temperature, they will ignite and emit noxious gases. If a single cell ignites, it will heat up adjacent cells, which will in turn also ignite. If the cells are not immediately cooled down, a chain reaction will be set off causing, what is called a ‘thermal runaway’.
Lithium-ion battery fires can lead to a “catastrophic explosion,” which fires suppression systems are “incapable of preventing,” the FAA said in an alert. This is no news for the seasoned traveler who is advised not to carry power banks in the check-in luggage. Such fires downed Boeing 747s in Dubai and South Korea in 2010 and 2011, killing all crew members (no passengers were on board). Then, a series of battery fires in the batteries of Boeing 787s prompted the FAA to ground the entire Dreamliner fleet in 2013. In 2021, a smoking lithium-ion battery in a flight attendant’s credit card reader prompted an emergency landing in Buffalo [13].
Despite mitigation through safety systems, utility-scale battery system fires do occur. The development of BESS facilities over the past 10 years has been accompanied by a rise in the frequency of spontaneous fires. In Korea there have been 30 BESS fires since 2017 leading to the Korean authorities imposing a moratorium on building BESS until the causes were investigated. It was found that some grid-scale battery fires occurred in coastal areas with higher humidity.

Figure 6: Reminding of the nearly two-week-long fire at a 250MW/1GWh battery energy storage facility in California in May 2024 near San Diego
Key Point 10: A 1 GWh utility-scale lithium-ion battery system is equivalent to nearly 900 tons of TNT, with potential for large explosions, fires and clouds of toxic gas.
Recycling low value LFP batteries without cobalt or nickel, is uneconomical, and we can expect illegal “exports” and dumping.

Figure 7: Workers at Agbogbloshie, Ghana, handling electronic waste | Source: Wikipedia
The threat of battery explosions and fires is illustrated by several incidents at sea as well as on land [sources see 14].
- Vistra Energy’s, claimed the World’s largest, battery plant was on fire in Central California in January 2025, several other fires occurred in CA in the years before
- China banned uncertified and recalled power banks on planes following an incident earlier in 2025 with Air Busan where a plane burnt down.
- Lithium-ion battery fire in a cargo ship takes several days to burn out and cause a lot of damage and are a risk to the crew. MV Felicity Ace in 2022 and MV Genius Star XI in 2024 are just two examples of many
- A major fire broke out at CATL’s Z base, one of its core battery production facilities in Sep 2024.
It should be noted that despite the overall increase in deployments and safety incidents, the rate of explosions and fires per GWh installed has decreased, indicating progress in safety [15] but what does this bring us if we are multiplying installed battery capacity the way it is planned?
I will not get into the environmental impact of the increased raw material, processing, manufacturing, and energy requirement for utility-scale battery systems… millions and billions of additional tons and terawatt hours of energy. The raw materials need to be mined, upgraded, transported, refined, and manufactured into products. Suffice it to say: without wind and solar, there would be no need for utility-scale batteries at the scale envisioned and none of the environmental impacts they bring.
How about recycling and disposal? Battery recycling includes two main stages, (1) Pre-Treatment of batteries into what is called “Black Mass” and (2) Refining of black mass into recycled material into high-purity, battery-grade lithium-, nickel-, and cobalt-based chemicals. Pre-Treatment – expected 4.6 Mln t capacity in 2025 – is 80% concentrated in China. Refining – expected 2.8 Mln t capacity in 2025 – is 90% concentrated in China [15a]
The recycling of battery cells is probably 5-10x less energy intensive than building brand new battery cells, but because of the fast and vast global ramp up, there is no way that recycled batteries can contribute any meaningful portion to the envisioned battery build out during the next decade. Interesting is that LFP batteries do not contain cobalt or nickel, so there is less economic incentive for traditional recyclers (6-10x lower than for an NMC battery). The contained iron, lithium, phosphate, and graphite in LFPs simply has lower value and it could indeed be that recycling may actually add cost, not save money.
In Europe or China, the dumping of batteries is unlikely to happen, as it is tightly regulated or illegal. In India or the US for example, such regulation does not seem to be in place yet. Either way, I have seen large electronic waste dumps in Africa with “imported” material from Europe. Obviously, “exporting” electronic waste from China or Europe is NOT illegal, only the dumping thereof within their respective region.
7. Summary
In May 2025 alone, China deployed about 11 GWh utility-scale batteries [16] plus over 55 GWh of EV batteries. For the production of just these grid-scale batteries (without for EVs), China needed to “invest” about 8 million tons of raw materials (ores) and about 5 TWh of energy. Let me tell you a secret… those 5 TWh did NOT come from wind or solar but probably mostly from coal and some hydro power.
- In comparison to China, Germany’s entire installed battery storage capacity reached 20 GWh around mid-June 2025, of which less than 4 GWh were utility-scale, the rest is largely residential. At 60 GW, the 4 GWh last a whole 4 minutes.
So let us summarize (Figure 8):
Utility-scale battery systems serve the grid in many ways, but what is not often discussed are the realities or externalities surrounding them. Therefore, let’s condense and list those realities in 10-points:
Point 1: Most utility-scale batteries are ONLY required because of the ever-increasing installed capacity of intermittent, weather dependent wind and solar power, which are largely useless without extensive and complex network integration, backup, and storage systems.
—
Point 2: Utility-scale batteries are ONLY short duration energy storage systems, they provide backup storage for a few hours at best, not for days or weeks. Thus, “solar + batteries” does NOT provide dispatchable 24/7/365 power.
—
Point 3: Utility-scale batteries deteriorate at a rate of 3-7 % p.a. and batteries should neither be fully discharged nor charged to 100%, as this degrades their lifespan.
- In practice, the recommended range is 20% to 80%, meaning only around 60% of the nameplate capacity is actually usable on a daily basis.
—
Point 4: Utility-scale batteries are expected to last on average 10-13 years. Real life round-trip efficiency (RTE) of utility-scale batteries is around 70-80% realistically.
Point 5: In real life a 4-hour Lithium-Ion LFP utility-scale battery system all-in costs, not necessarily price quoted, in 2024 to 2025 range from ~150-250 USD/kWh.
—
Point 6: Raw material or commodity prices, excluding gold, are at historically low levels in comparison to equities… something will have to give, my take is that commodity prices will rise impacting long-term battery costs.
—
Point 7: 1 GWh of utility scale lithium-ion batteries requires ~0,7 million tons of raw materials (ores) to be mined, upgraded, transported, processed, and manufactured into utility scale batteries. Details in Appendix.
- China controls ~90% of battery cell component manufacturing (anodes, cathodes), ~80+% of battery cell manufacturing, and majority of raw material processing for batteries.
—
Point 8: 1 GWh of utility scale lithium-ion batteries requires ~450 GWh of energy (Table 3) before the battery can be charged for the first time.
- A standard Gigafactory, with an annual battery production capacity of about 50 GWh, would require over ~20 TWh of energy annually, inc. the embedded energy of the metals and materials consumed p.a. This compares to the city of Berlin in Germany consuming 12 TWh electricity annually.
—
Point 9: 100 Wh/kg energy density for utility-scale batteries at system level (not cell-level) is very aggressive and generous.
- Today’s reality lies more around 50 Wh/kg, which is confirmed by various data points, and would then double the tonnage and energy estimates mentioned
- The 1-ton battery, when charged, contains the same amount of energy as 40kg of coal, already accounting for 40% power plant efficiency.
—
Point 10: A 1 GWh utility-scale lithium-ion battery system is equivalent to nearly 900 tons of TNT, with potential for large explosions, fires and clouds of toxic gas.
- Recycling low value LFP batteries without cobalt and nickel, is uneconomical, and we can expect illegal “exports” and dumping.

Figure 8: Utility-scale battery fact sheet, Source: Schernikau
Appendix 1: Calculating metal content, ore content, and energy required for utility scale batteries
The table below summarizes the key metal and material components for LFP – Lithium Iron Phosphate utility-scale batteries. It includes the approx. weight of metal and the approx. ore ratio. The ore ratio is how much ore needs to be mined to get the metal, in kg ore per kg metal. It also includes an estimate for the energy required to make these metals available. Embedded energy estimates are factoring in all upstream and fuel-based inputs. My assumption is that the quoted embedded energy numbers are too low and does not really include all mining, upgrading, transportation and refining.
Remember, these are all more realistic estimates based on preliminary research. I am confident that, after more detailed research, the total numbers would not change dramatically in order of magnitude, they should be correct within a 30-50% band. Over 4 years ago, I had estimated in a published report (here) that the metal to ore ratio is 1-2%, matching the 1,5% the analysis herein concluded. (see Table 6)
Key Point: The embedded energy of metals and materials required to build utility-scale batteries make up about 90% of the entire energy input required for BESS.

Table 5: Estimated total energy use for lithium-ion utility-scale battery manufacturing | Source: Schernikau based on [9 and 10]
The total utility-scale battery back energy consumption is then summarized again in Table 5 (copied from Section 4 above). I conservatively estimate that around 400-500 kWh need to be invested to produce 1 kWh of utility-scale lithium-ion battery, assuming a generous 100 Wh/kg energy density and system level. 90% of the energy comes from the embedded energy in the metals and materials required for batteries.
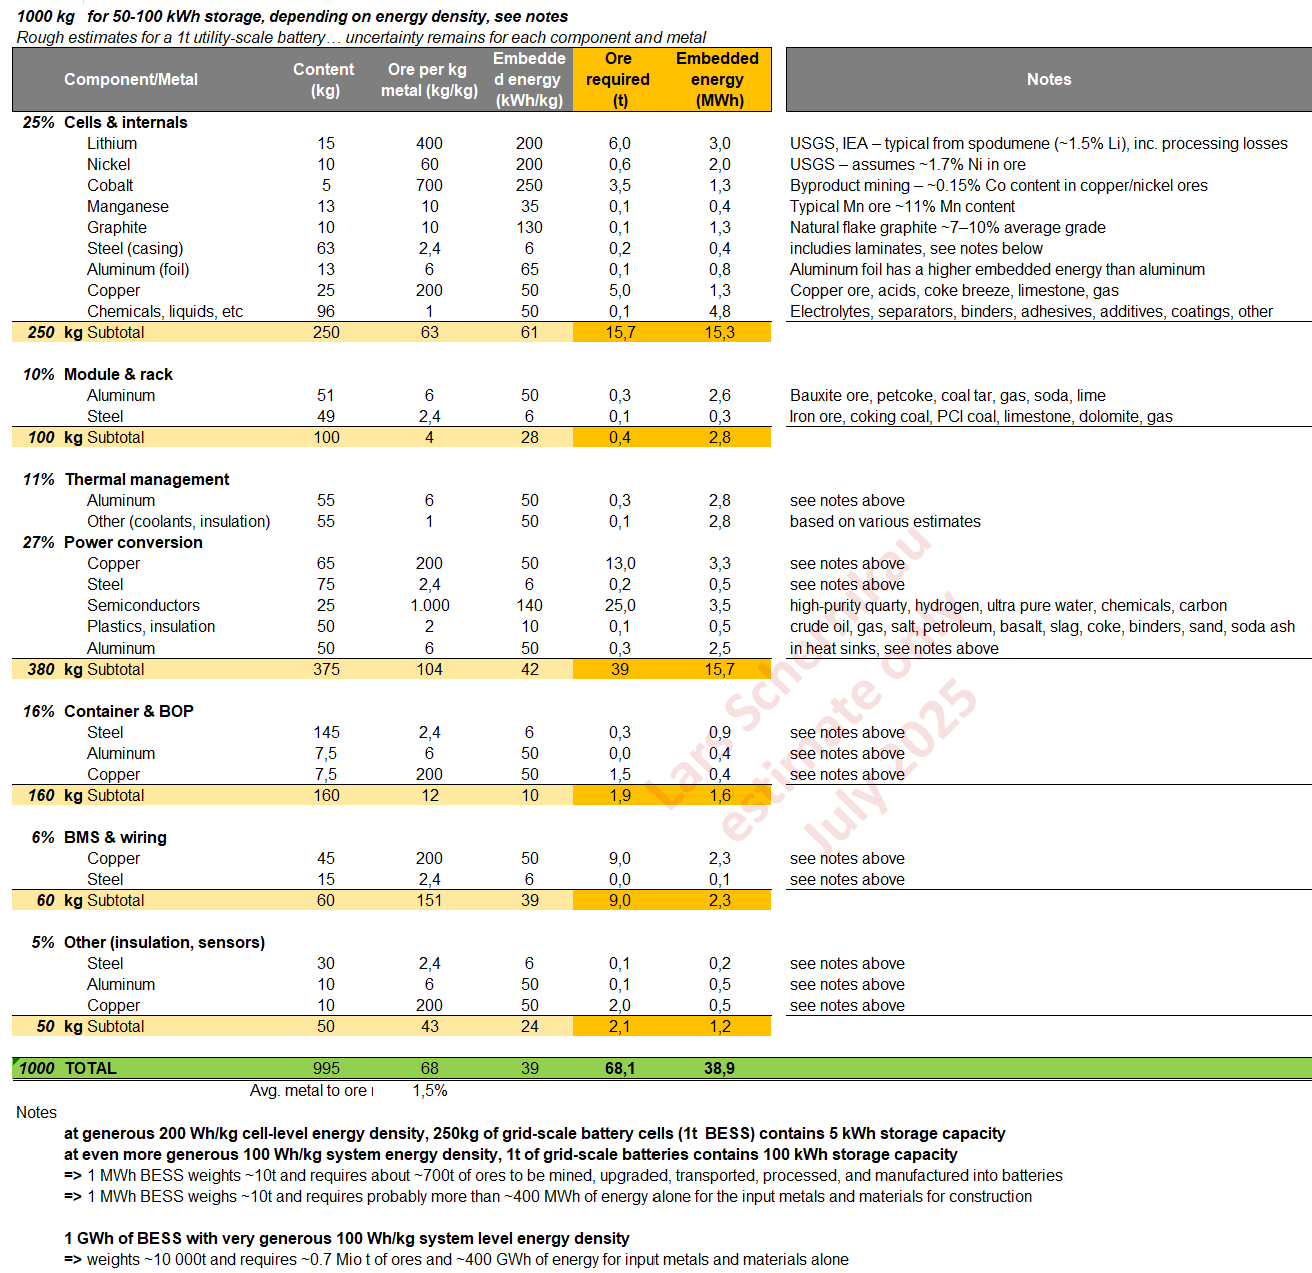
Table 6: Estimated metal and ore ratio, and embedded energy for grid-scale batteries | Source: Lars Schernikau based on research, analysis, industry know-how, and interviews, details at [9]
Appendix 2 Definitions, Links and Resources
EVs = Electric Vehicles
- Definition of BOS: BOS stands for Balance of System. It encompasses every component of a utility-scale battery system aside from the battery cells themselves:
- Mechanical structures (racks, enclosures, mounting frames)
- Thermal management (cooling/heating loops, heat exchangers)
- Electrical balance (cabling, busbars, fuses, connectors)
- Power electronics (inverters, converters, transformers)
- Monitoring & controls (battery management system, SCADA interfaces)
- Safety and auxiliary systems (fire suppression, lighting, grounding
- BESS stands for Battery Energy Storage System, which refers to a complete setup that captures, stores, and dispatches electrical energy using rechargeable batteries.
Core Components of a BESS include:
- Battery modules (cells, modules, racks)
- Power conversion system (PCS) or bidirectional inverter
- Battery management system (BMS)
- Energy management system (EMS) or control software
- Balance of System (BOS) elements (cabling, enclosures, cooling/heating)
- Safety & protection systems (fuses, fire suppression)
These elements work together to charge from and discharge to the grid or local loads, ensuring safe, efficient, and reliable operation
- LFP: Lithium Iron Phosphate. In an LFP battery, iron phosphate serves as the cathode material, offering high thermal stability, long cycle life, and better safety compared to other lithium-ion chemistries.
- NMC: Nickel Manganese Cobalt. NMC batteries blend those three metals in the cathode to achieve a balance of high energy density, good cycle life, and reliable performance, making them a popular choice for electric vehicles and grid storage.
[1] IEA 2024, Batteries and Secure Energy Transitions – Analysis, April 2024, (link)
[2] Prof Lion Hirth on storing electricity vs oil gas, July 2025, (link)
[3] DeSantis et al 2021: Cost of Long-Distance Energy Transmission by Different Carriers, iScience 24, no. 12 (2021): 103495, (link)
[4] “NetZeroWatch: Gridscale Batteries and Fire Risk,” October 2024, (link)
[5] BloombergNEF, Global Energy Storage Growth Upheld by New Markets | BloombergNEF, June 2025, (link)
[6] NREL 2024, Batteries – 2024 Cost Components,” NREL, 2024, (link)
[7] RenewEconomy on Utlity Scale Battery costs… ‘Watershed Moment:’ Big Battery Storage Prices Hit Record Low in Huge China Auction,” RenewEconomy (blog), July 2025, (link)
[7a] Schandl et al 2024: Global Material Flows and Resource Productivity: The 2024 Update, Journal of Industrial Ecology 28, no. 6 (2024): 2012–31 (link)
[8] Michaux 2024: Estimation of the Quantity of Metals to Phase out Fossil Fuels in a Full System Replacement, Compared to Mineral Resources – Publications, Reports, Maps and Posters,” Hakku, August 2024, (link)
[9] Material and energy balance as well as ore ratios are based on a number of sources, including but not limited to Schernikau research and analysis, dozen of industry interviews, Prof Simon Michaux, miningforzambia.com, lithiumharvest.com, inchem.org, USGS, natural-resources.canada.ca, IEA, Cobalt Institute, Int’l Aluminum Institute, Michala et al 2025, Zhang et al 2022, Mohr et al 2020, LBNL 2022 ‘Cost and Material Composition of Power Electronics in Grid Applications’, BNEF 2022–2023 ‘Inverter Material Supply Chains’, Tesla Megapack teardown (Munro & Associates, 2022)
[10] Information on Gigafactory Energy use are based on
- Degen et al. (2023), Nature Energy (link)
- Kuki et al. (2025), MDPI Environments (link)
- Fraunhofer FFB Study, (link)
- DOE Energy Storage Durability (2024) (link)
- MDPI Batteries (2024), Pack Assembly (link)
- IEA Commentary (2024) (link)
[11] Fordham et al 2021, (link)
[12] Marlair et al 20xxx, (link)
[13] ABC. News, “Lithium Batteries Could Spark ‘Catastrophic’ Plane Fires, FAA Warns,” ABC News, March 2022, (link)
[14] Battery Fires and risks
- “World’s Largest Battery Plant on Fire in Central California – POLITICO,” January 2025, (link)
- “A Lithium-Ion Battery Fire in a Cargo Ship’s Hold Is out after Several Days of Burning,” AP News, January 2024, sec. Business, (link)
- “China Bans Uncertified and Recalled Power Banks on Planes,” Reuters, June 27, 2025, sec. Technology, (link)
[15] Bridging the Fire Protection Gaps: Fire and Explosion Risks in Grid-Scale Battery Storage,”April 2025, (link)
[15a] Benchmark, May 2025,(link)
[16] China Dominates May Global Deployments with 11.2GWh” Energy-Storage.News, June 10, 2025, (link)
[17] Julien Jomaux, “LI: Jomaux on Europe Grid Batteries,” May 2025, (link)
[18] BESS technologies and the information provided are based on various sources, including but not limited to [1] above; BloombergNEF Energy Storage Market Outlook Q2 2025; NGK Sodium-Sulfur Technical Brochure 2025; Sumitomo Redox Flow Brochure 2025, India Institute of Science Na-Ion Research, 2024; DOE Battery Lifetime Study 2024