
In 2015, The International Energy Agency (IEA) issued its first “World Energy Investment” report. For the 10th anniversary edition issued in June 2025 I took the time and scanned through the 255 page document, to synthesize some of the key points for you (and myself 😊). I also revisited the World Energy Investment edition from 10 years ago to refresh my memory and to draw comparisons 10 years later.
As always, I will be highly selective and biased in what I show and write.
The point is not to “go after” the IEA, but to employ critical thinking about the future of energy and where we are headed.
Two key outcomes:
- Wind and solar receive about 7x more money than coal, gas, and nuclear combined, normalized by TWh generated.
- 80% of primary energy supply (oil, coal, gas) only get about 1/3rd of investments, in absolute terms that is 25% less than 10 years ago
Please remember, the IEA was fundamentally established to promote reliable and affordable energy, primarily for the industrialized world.
Here my short review of the world of energy…enjoy!
- 10-Year History of the IEA
The International Energy Agency (IEA) was established in 1974, following the 1973 oil crisis. Its original mission was to help major industrialized nations within the OECD to coordinate efforts ensuring reliable energy supplies, with a strong focus on oil security and emergency measures such as building up strategic petroleum reserves.
Over the years, the IEA expanded its reach to cover other energy sources — natural gas, coal, nuclear power, and more recently, what’s commonly referred to as “renewable” energy, such as wind and solar. It also expanded into areas like energy efficiency and climate policy. Today, the agency serves as a key global voice on energy issues, producing widely read reports like the World Energy Outlook.
In its early days, the IEA faced criticism for favouring fossil fuels and for underestimating how quickly wind and solar energy could grow. In the 2020s the IEA begun to align more with “climate goals”, notably with its 2021 Net Zero by 2050 report, which marked a significant shift by calling for an end to new fossil fuel investments… something that fills me with regret and great concern… not because I love fossil fuels but because I am concerned about long-term energy security… something the IEA used to be consider as well.
Overall, the IEA’s history reflects a gradual but significant transition from a fossil-fuel-centric organization to a broader “anti-fossil” energy advocate… or many would say the “International Climate Agency”… ultimately deviating from its purpose and initial stated goal of focusing on reliable (and affordable) energy supply.
I remember my excitement in November 2015 when I first read the 718 page “World Energy Outlook” published by the IEA, which by the way, is different from the “World Energy Investment Report” but is of course consistent with its data. At the time, the document was absolutely incredible… summarizing the global world of energy with analyses, tables and forecasts then already, lead by Dr Fatih Birol.
In 2015, India was home to one-sixth of the world’s population, was the third-largest economy, but accounted for about 5% of global energy use and one in five of the population – 260 million people – still lacked access to electricity.
10 years ago, 17% (about 1 to 1.2 billion) of the global population – were without electricity, and 38% (2.7 billion) of the global population put their health at risk through reliance on the traditional use of solid biomass for cooking… that’s a total of 55% or 3.9 billion at the time
In 2025, India still holds one sixth of the world population, still is the third largest economy, now accounts for 6% of global energy use and India achieved reportedly universal access to electricity by 2022.
Globally, in 2025 about 750 million (9%) are without electricity and 2.3 billion (28%) still rely on traditional use of solid biomass for cooking.

Figure 1.World Energy Outlook: Source: World Energy Outlook 2015 [1]
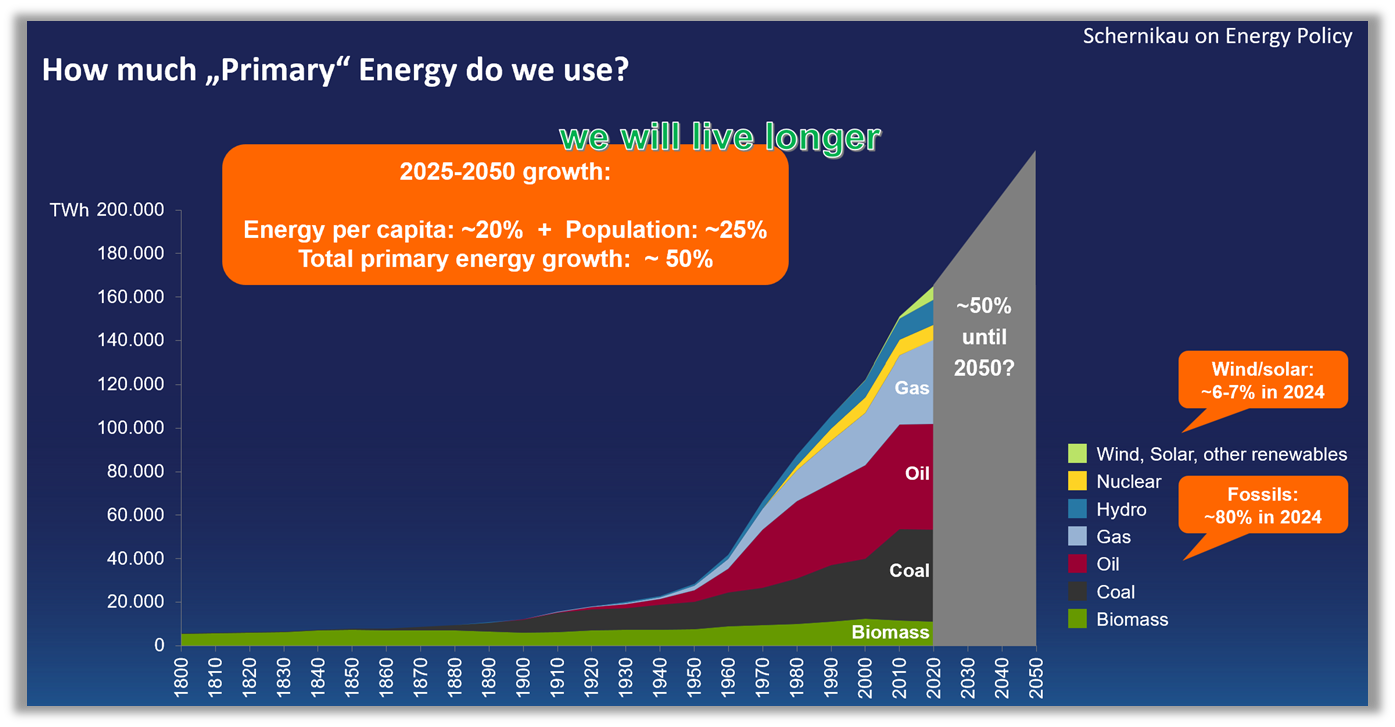
Figure 2: Global Energy Use, Sources: Author based on [2,3,4]
Despite referencing the falling (marginal cost) Levelized Cost of Electricity (LCOE) for wind and solar, the WEO 2015 understated the growing cost of system integration, such as the need for backup dispatchable capacity, grid upgrades, and storage to handle the intermittency and volatility of wind and solar. These hidden costs become increasingly significant as wind and solar penetration rises, leading to potential grid reliability issues and price instability, as currently seen in markets like Germany and recently Spain.
The 2015 report’s endorsement of natural gas as a “bridge fuel” is still today, mirrored in many western nations.
From an affordability perspective, the IEA correctly stressed the need for massive investment (over $68 trillion by 2040), but it underplayed the risk of misallocated capital toward variable wind and solar without sufficient attention to firm capacity and grid resilience, a critical oversight for systems that must deliver reliable power 24/7/365.
Bottom Line: The WEO 2015 acknowledged the upcoming rise of wind and solar power but already lacked (like today) a realistic assessment of their system-level costs and reliability impacts. It implicitly supported a high-cost, high-complexity path in markets pushing wind and solar aggressively without firm capacity planning.
WEO 2015 other key points:
- Oil Prices & Market Dynamics: The report examined the sharp decline in oil prices and explored scenarios where prices could remain lower for longer, impacting investment and market stability.
- India’s Energy Growth: India was identified as a major driver of future energy demand, with rapid economic growth reshaping global energy consumption patterns.
- “Renewables” & Efficiency: The competitiveness of wind and solar energy was increasing (as per the report, wrongly using LCOE), and energy efficiency policies were expanding worldwide.
- Coal & China’s Transition: Coal demand in China was expected to plateau as the country shifted towards “cleaner” energy sources (note: in 2025 coal still has not plateaued in China. China’s coal consumption increased from 3.5 billion tons to 5 billions tons in those 10 years, that is a 40% increase!)
- Global Energy Demand: Energy demand was projected to grow by nearly one-third by 2040, with most of the increase coming from non-OECD countries.
- Electricity & “Renewables”: Wind and solar were expected to overtake coal as the largest source of electricity by the early 2030s, with significant growth in solar and wind power
2. 2025 Energy Investments – Cause for concern
Electricity: Wind and solar receive 7x more investment than dispatchable coal, gas, nuclear, hydro (per TWh generated) combined
Oil, coal, and gas investment – as share of total investment – went down from 55% ten years ago to 33% today. Oil coal and gas make up 80% of total energy supply.
***Note: T$ = Trillion USD
The IEA and others call out the ‘Age of Electricity’ because of the rapid rise in electricity demand due to industry, cooling, electric mobility, and data centers for artificial intelligence (AI) and blockchain applications.
Total global energy investments continue to drop in % terms: from 2.7 T$ (3.6% of global 2015 GDP of 75 T$) to expected 3.3 T$ in 2025 (2,9% of global 2025 GDP of 115 T$). About 2/3rds or around 2.2 T$ is going to wind, solar, nuclear, grids, storage, low-emissions fuels, efficiency and electrification collectively. 10 years ago, oil, coal, and gas, used to receive 55% of total energy investment … now its down to 33% (1.1 T$)
So let’s get this straight… total energy investments, as a percentage of global GDP, are reducing, and 80% of primary energy supply (oil, coal, gas) only get about 1/3rd of investments, in absolute terms that is 25% less than 10 years ago… This is despite a rise in energy “harvested” from oil, coal, and gas. (See Figure 2 above)
- In fact this reduced investment aligns with IEA’s Dr. Fatih Birol’s 2022 urge at WEF Davos “not to lock in our future by using the current situation as an excuse to justify investments in large, long-term fossil fuel projects” [5]
Many developing economies, especially in Africa, are logically struggling to mobilize capital for energy infrastructure… as financial institutions are very reluctant to put dollars into coal, oil, or gas infrastructure. Gas, in many jurisdictions, has it much easier though.
Interestingly, China is the largest global energy investor by a wide margin, and its share of global wind, solar, and EV energy investment has risen from a quarter, ten years ago, to almost one-third today.
Last year, China started construction of the largest number of coal-fired power stations in 10 years. When it comes to energy, China is clearly doing something different from the rest of the world, and there have good reason in doing so. The US recently shifted its stance on energy investments for the better. Europe is still taking a backseat.
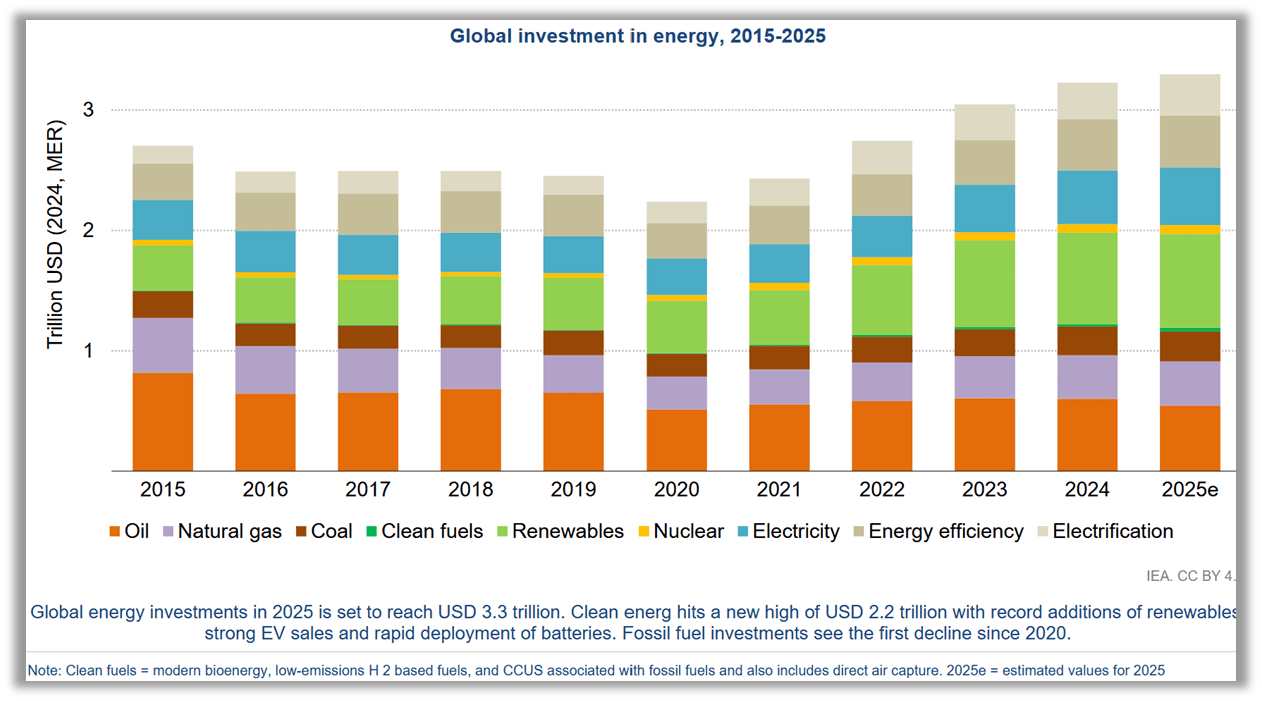
Figure 3: Global energy investment 2015-2025
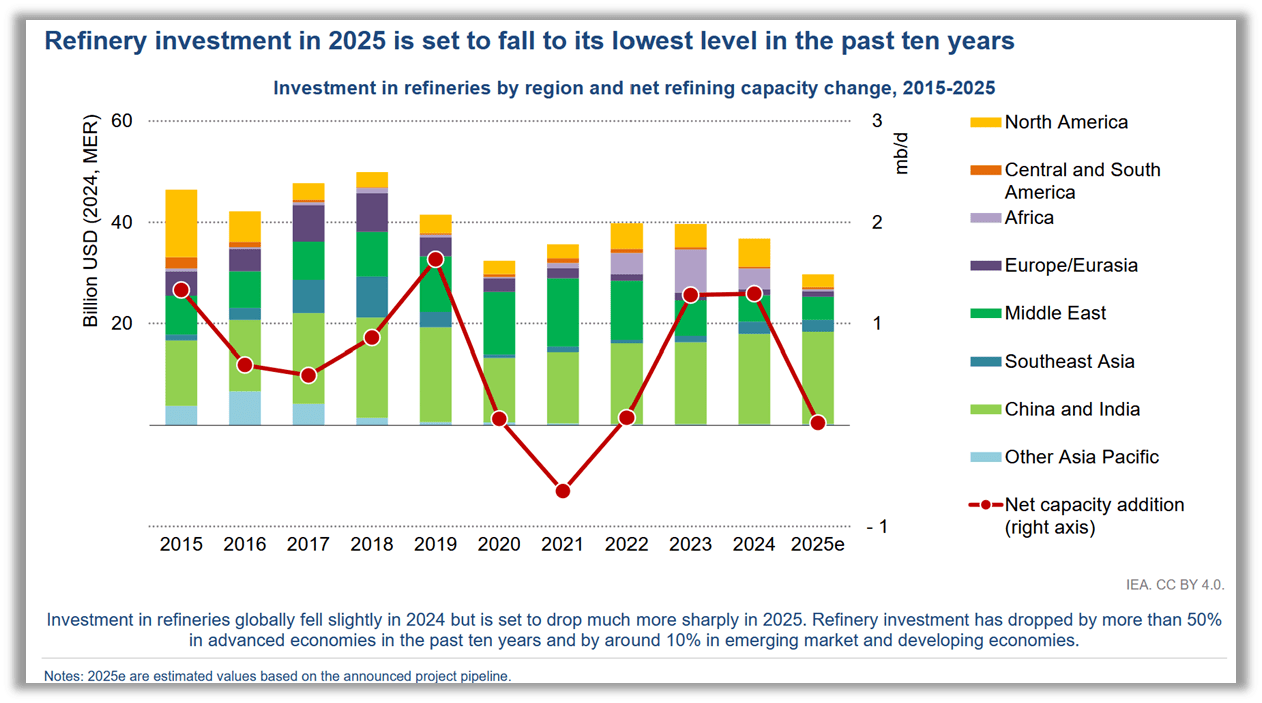
Figure 4: Also refinery investments are insufficient… growing demand for refined products is not met with sufficient investments with a long-term view
Fast-growing electricity use and concerns about electricity security underpinned the mentioned wave of coal plant approvals in China. China gave the green light to almost 100 GW of new coal-fired power plants in 2024, and India a further 15 GW, pushing global coal power plant approvals to their highest level since 2015.
- Investments in coal supply continue to tick upward with another 4% increase expected in 2025, slightly slowing down in comparison to the 6% annual average growth seen over the last five years. Nearly all the growth in coal investments in 2024, to meet domestic demand, came from China and India.
Ten years ago, investments in oil, coal, and gas supply were 30% higher than those for electricity generation (power plants, solar, wind), grids and storage. Today, these positions are reversed. Investment in the electricity sector is set to reach USD 1.5 trillion in 2025, some 50% higher than the total amount spent on bringing oil, natural gas and coal to market.
As depicted in figure 3, it appears that energy investments are increasing, but let’s dissect this and consider the information from a different point of view distinguishing between investments that actually “supply energy” and investments that actually “consume energy”.
Solar PV and wind accounted for a large 15% of electricity in 2024 but received 98% of investment growth in electricity generation over the past decade … while in TWh wind and solar made up 40% of the growth in power supply in 2015. Only 2% of the investment growth over the past 10 years went towards coal, gas and nuclear (70% of electricity generation, 60% of power growth during that time).
Needless to say, when 2% of investment growth is funding 60% of power supply growth, one gets a sense of the energy-efficiency of coal and gas, the net-energy-inefficiency of wind and solar, and also the lack of investment globally… including the consequences to follow.
Wind and solar receive about 7x more money than coal, gas, nuclear combined normalized by TWh generated (directly from the global investment chart – figure 3).
3. Costs and Profitability
The IEA World Energy Investment 2025 report is quite open about the fact that “wind and solar” are not profitable businesses, neither for equipment manufacturers, nor for utilities, and certainly not for governments. Consumers are incentivized by large subsidies that are paid by the taxpayer.
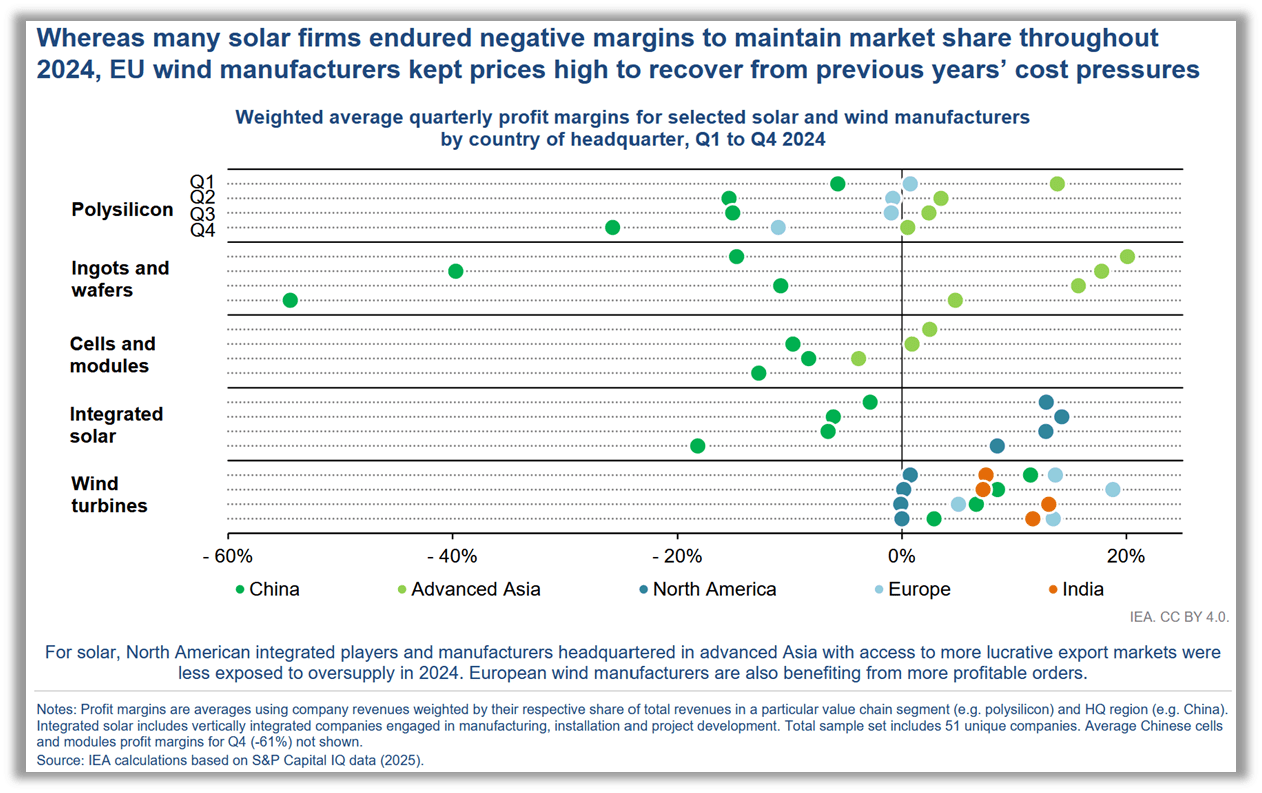
Figure 5: Quarterly profit margins for selected wind and solar manufacturers
China is the most “competitive” solar panel supplier in the world and of course loses the most money as the IEA points out (below graph). A recent Solar power conference in Shanghai, China pointed out how difficult the situation within the industry is.
- “Most of the world’s solar farms are powered by cells and modules made in China, but the country’s top producers are facing billions of dollars in losses as cutthroat competition has pushed prices below cost level.” [6]
Shanghai Metals Market’s data suggests that global output of solar panels dropped 7% in May 2025 from the previous month and is expected to decrease by another 4-5% in June 2025. Producers continue to reduce solar power equipment production, facing uncertainty about the outlook on demand due to policy changes on solar power project investments globally.
The IEA also confirmed that the concentration and therefore risk and dependency of supply across all critical mineral segments required for the “energy transition”., continued to increase during the past 5 years. The so called “new clean domestic” power supply from wind and solar is largely dependent on one country… is this optimal?

Figure 6: Geographical concentration of supply rising

Figure 7: The power industry is also struggling with a shortage of skilled labor and supply equipment. For instance, transformers and cables have doubled in price in the past 10 years in Europe.
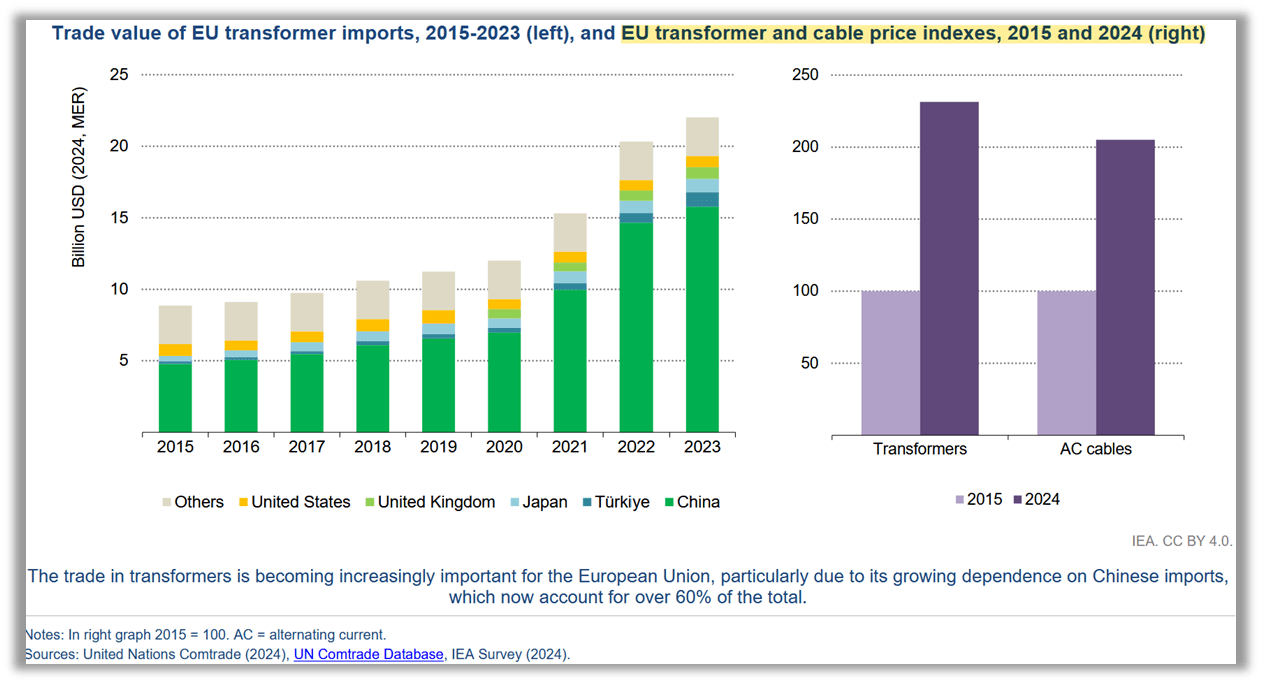
Figure 8: Needless to say, “the rise of sustainable finance over the last decade is facing headwind”… as the IEA report confirms.
There is a large push for new LNG capacity as 2026 and 2028 is likely to see some of the largest ever annual expansions in LNG capacity. This is driven by the misleading idea that LNG is “better for the climate” than coal and that gas, will be a better “bridge fuel” for the – IMHO’s falsely proclaimed future “hydrogen economy”.
All of which is not the case and has been shown in detail by multiple peer-reviewed research paper and also plain commons sense (more detailed here – Coal and Gas here and Hydrogen here).
I repeat that we need both coal and gas, but to pretend that the – on average – more expensive LNG is better for the environment and economies than coal is simply not correct.
There is a reason why Bangladesh and Pakistan have been rethinking their LNG import strategies… and why Southeast Asia has confirmed in writing in 2024 “transition away from coal should be done in a just, gradual way when economically and environmentally viable alternatives are available at grid scale“ .. in other words: those alternatives are not available now…[7]
4. Summary
The IEA World Energy Investment 2025 report is filled with many more interesting facts and information.
My key points, not in order of importance, are:
- Nuclear is making a coming back… and it should, but it won’t suffice (see my Oxford Institute on nuclear)
- Total investment in energy is reducing as a % of GDP, while it should increase
- Investment share in reliable dispatchable power is insufficient, investments in weather dependent wind and solar are going “through the roof”
- Investments in reliable fuels (exemplified by refinery investments) are insufficient
- Wind and solar or so called “renewable” industry participants lose billions as they struggle to make money with funding becoming a larger problem than we thought
- In Southeast Asia, almost 70% of additional electricity demand in 2025-2027 is expected to be met by mostly coal and some gas-fired generation
- Example Vietnam: Coal-fired generation jumped 14% y-o-y 2023 to 2024, with its share in total generation inching up to 49%, versus 47% in 2023
Figure 9 below is one way of illustrating – normalized by TWh – the mismatch between investments in intermittent wind and solar vs. dispatchable power from coal, gas, nuclear, and hydro. Wind and solar receive about 7x more money than coal, gas, and nuclear combined, normalized by TWh generated.
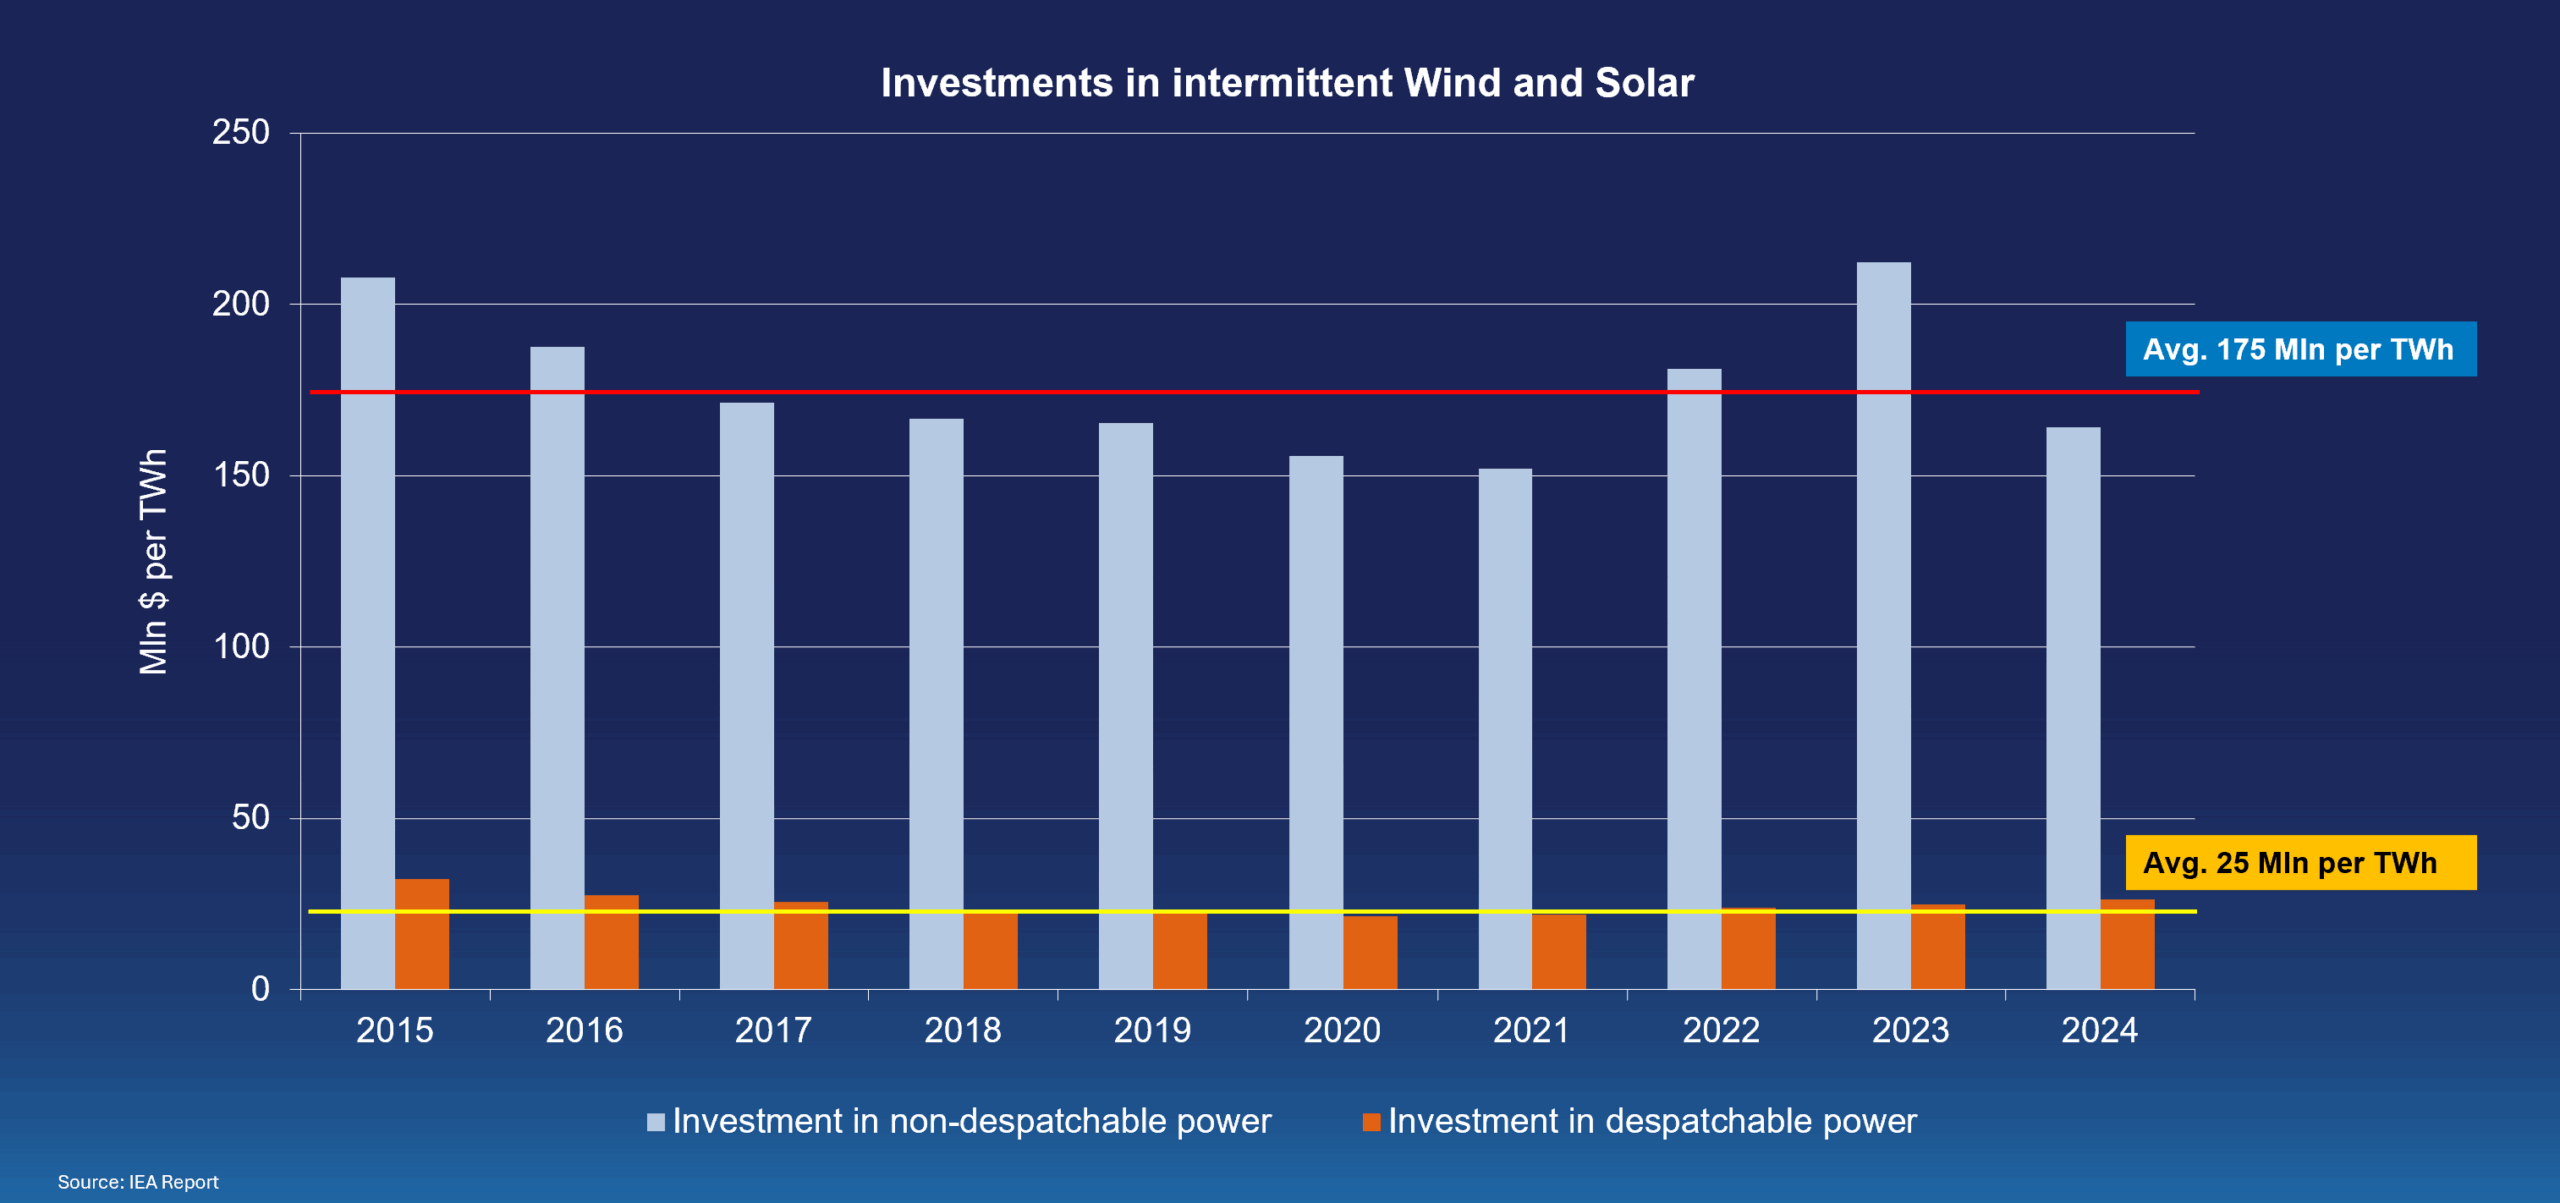
Figure 9: Investments in intermittent Wind and Solar 7x higher than in desptachable Coal, Gas, Nuclear, hydro | Source Schernikau based on IEA World Energy Investment 2025 and IEA
Links and Resources